Table 1 Factors and their coded levels used in RSM
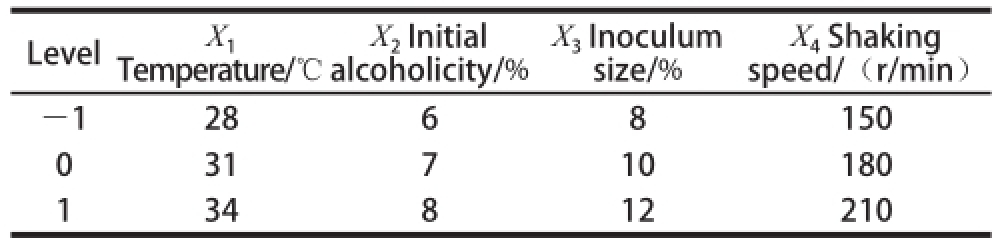
Level X 1Temperature/℃X 4Shaking speed/(r/min)-1 28 6 8 150 0 31 7 10 180 1 34 8 12 210 X 2Initial alcoholicity/% X 3Inoculum size/%
WANG Chuyan
1,2, FAN Tao
2, HU Qingguo
1, XU Chenchen
1, CHEN Chen
1
(1. Department of Biological and Environmental Engineering, Hefei University, Hefei 230601, China;2. Sericultural Research Institute, Anhui Academy of Agricultural Sciences, Hefei 230061, China)
Abstract:In the production of fruit vinegar, the key step is to obtain acetic acid from alcohol by Acetobacter fermentation. Available information has shown that the yield of acetic acid is affected by the starter culture, the fermentation environment and alcoholicity. In this study, mulberry fruit wine was used as the raw material to brew fruit vinegar. Acetobacter pasteurianus W6, isolated from Solid-State Vinegar Grains of Zhenjiang Hengshun, was used as the starter culture. Response surface methodology (RSM) was used to optimize the fermentation conditions of mulberry fruit vinegar by analyzing their effects on acetic acid production. The results demonstrated that the optimal conditions for mulberry fruit vinegar fermentation were temperature of 32.5 ℃, initial alcoholicity of 7.5% (V/V), inoculum size of 10% (V/V), and shaking speed of 160 r/min. Under these conditions, the yield of acetic acid was 5.85 g/100 mL. The experiments showed that W6 strain was very active in producing acetic acid.
Key words:mulberry fruit vinegar; Acetobacter pasteurianus; fermentation conditions; response surface methodol ogy
Mulberry is a tree that can grow in many places around the world. Its distribution ranges from temperate and subtropical regions of the northern hemisphere to tropical rainforests of the southern hemisphere. It even grows at an elevation of 4 000 m on the Qinghai-Tibet plateau [1]. Mulberry fruit is the mature fruit from the mulberry tree and is rich in flavonoids, phenols, polysaccharides, resveratrol, vitamins,volatile oil and other ingredients [2-3]. Mulberry fruit is used as a traditional Chinese medicine and food, and has many functions as an anti-oxidant, which lowers blood pressure,reduces low density lipoprotein level, enhances immunity and can replenish vital essences to tonify the kidney and maintain beauty and youth [4]. At present, various food-grade mulberry fruit products (that is, juice, jam, fruit ice-cream, dried fruit,fruit yogurt and fruit wine) have been developed commercially as functional foods in some traditional sericulture countries,such as China, Japan and Korea [5]. In some European countries,mulberry trees are grown for fruit production, with certain applications in some traditional foodstuffs [6]. However, because of fragile structure and low stability in storage, fresh fruit is hardly commercialized, it is usually processed as juice, frozenfruit, there is also the possibility of further commercializing its fermented product [3].
Vinegar is a highly nutritious type of acidic seasoning that originated in China. It is used not only as an acidic condiment, but also as a food preservative in the food industry [7-9]. The fermentation techniques for vinegar can be roughly divided into solid-state fermentation and liquid-state fermentation. In China, most manufacturers use the traditional solid-state fermentation, whereas in Europe and the USA,liquid-state fermentation is more popular. The different fermentation techniques result in the diverse characteristics of the different types of vinegar. Studies on vinegar have primarily focused on the isolation and identification of acetic acid bacteria, the taxonomic study of acetic acid bacteria,the selection and culturing of efficient acetic acid bacteria,improvements in brewing techniques and the d evelopment of new types of fruit vinegar [10-12].
Fruit vinegar, as a kind of desirable functional food,is based on the processing of fruit or fruit scraps and use of modern biotechnology to brew a nutrient-rich, unique flavor acidic condiment. However, fruit vinegar can be obtained from the fermentation of fruit wine using Acetobacter. It has been used to make onion vinegar, cider vinegar, wine vinegar,lemon vinegar, blackberry vinegar, persimmon vinegar and many others [13-16]. Vinegar production requires a series of processes, but in the fermentation process, Acetobacter is the most important factor [17-19]. The surrounding environment is very important, too. The yield of acetic acid depends on many factors, such as fermentation temperature, time, pH value and oxygen content [20].
Response surface methodology (RSM) is a statistical method that can be used to optimize experimental projects and improve experimental efficiency [21]. This method has been extensively used to optimize fermentation processes,such as fermentation conditions to brew rice vinegar [22],solvent extraction of bioactive compounds [23], production of enzymes [24], and parameters for polymer synthesis and for food processing [25]. In this work, mulberry wine was used as the raw material for acetic acid fermentation by using Acetobacter pasteurianus W6. We focused on four factors to produce the optimum yield of acetic acid using RSM. They were temperature, initial alcoholicity, inoculum size and shaking speed. The optimal fermentation conditions for mulberry fruit vinegar were investigated. This study will provide a valuable reference for future industrial production of mulberry fruit vinegar.
1.1 Materials
1.1.1 Strains and Mediums
Acetobacter pasteurianus W6 was isolated and purified from Solid State Vinegar Grains of Zhenjiang Hengshun. It was used for 16S rDNA analysis (Genbank accession No. KC662507), and mulberry fruit vinegar fermentation.
According to the method for preparing the medium reported by Yu Zheng et al. [17], the slants medium contained 10 g of yeast extract, 15 g of glucose, 20 g of CaCO 3,35 g of ethanol, 17 g of agar and 1 L of water. The preculture medium had 15 g of yeast extract, 20 g of glucose, and 35 g of ethanol and 1 L of water. The mulberry fruit wine was brew by itself and used as the fermentation medium.
1.1.2 Mulberry fruit wine
Fresh mulberry fruit was harvested from the Mulberry Trees Breeding and Planting Center in Anhui. The fruits were manually washed, immediately frozen and stored at -20 ℃. Then, the frozen fruits were thawed at room temperature and crushed in a blender with a fruit blender at the speed of 100 ×g for 10 min. The crushed fruit was treated with pectinase, filtered with an industrial commercial sieve, and squeezed to extract the juice. Then the juice was ameliorated with sucrose and fermented with Saccharomyces cerevisiae. Finally, after carrying out sterilization by pasteurization, the mulberry fruit wine was obtaine d [5].
1.2 Methods
1.2.1 Preparatio n of cultivated mycelium
Acetobacter pasteurianus W6 was maintained at 30 ℃on the slants medium. Two steps are required to prepare seed cultivation. First, W6 was placed on the preculture medium and cultured at 30 ℃ for 2-3 days. Then, it was transferred into the mulberry fruit wine medium with a 10% inoculum size and kept at 30 ℃ for 2 days. The cultivated mycelium can be used in the fermentation of mulberry fruit vinegar.
1.2.2 Fermentation curve of acetic acid
A volume of 50 mL mulberry fruit wine with 7% alcoholicity was added to a 150 mL triangular flask. Six percent of the W6 mycelium cultivation was accessed and fermented at a temperature of 30 ℃ and a speed of 150 r/min,and then, the content of acetic acid and alcohol in the fermentation broth was measured every 12 h until the acetic acid content was stable.
1.2.3 Acetic acid content determination
The yield of acetic acid was determined by the nationalstandard method [26], we titrated fruit vinegar with sodium hydroxide solution until pH 8.2, then according to the formula of the literature to calculated total acid content. Organic acids different to acetic acid was considered non-relevant for titration. Therefore, in order to obtain the yield of acetic acid, we had to subtract the acidity of organic acid. Each test requires three parallel, then acetic acid content were measured respectively and finally averaged.
1.2.4 Single factor testing
1.2.4.1 Effect of temperature on acetic acid fermentation
A mixture of 6% (volume fraction) of the cultivated W6 mycelium, was inoculated to 7% of mulberry fruit wine at a shaking speed of 150 r/min and fermented at 25, 28, 31,34 a nd 37 ℃. The measurement of acetic acid content was carried out daily until the acidity level had not increased for two successive measurements. Then, the influence of fermentation temperature on acetic acid fermentation was showed and analyzed.
1.2.4.2 Effect of initial alcoholicity on acetic acid fermentation
A mixture of 6% of the cultivated W6 mycelium,was kept at a temperature of 31 ℃ and a shaking speed of 150 r/min and cultured at initial alcoholicity levels of 5%,6%, 7%, 8%, 9% and 10%. The value of acetic acid content was measured, then the effect of different initial alcoholicity levels on acetic acid fermentation was analyzed.
1.2.4.3 Effect of inoculum size on acetic acid fermentation
A mixture of 4%, 6%, 8%, 10%, 12%, 14% and 16% of the cultivated W6 mycelium, were inoculated in mulberry fruit wine with 7% alcoholicity and kept at 31 ℃ and oscilliate d at 150 r/min. Then, the effect of different inoculum size on acetic acid fermentation was analyzed.
1.2.4.4 Effect of shaking speed on acetic acid fermentation
Under 31 ℃,6% W6 mycelium cultivation and 7% initial alcoholicity, the mulberry fruit wine was fermented at speeds of 60, 90, 120, 150, 180 and 210 r/min. The measurement of acetic acid was carried out daily until acidity levels did not increase for two successive measurements. Then, the influence of speed on aceti c acid fermentation was analyzed.
1.2.5 Experimental design
On the basis of a single-factor test, in accordance with Box-Behnken Central composite design, we selected the fermentation temperature (X 1), initial alcoholicity (X 2),inoculum size (X 3) and shaking speed (X 4) as the independent variables, and the yield of acetic acid as a response value. The four-factor and three-level RSM experiment (Table 1) was designed to optimize fermentation technology of Mulberry fruit vinegar.
Table 1 Factors and their coded levels used in RSM
Level X 1Temperature/℃X 4Shaking speed/(r/min)-1 28 6 8 150 0 31 7 10 180 1 34 8 12 210 X 2Initial alcoholicity/% X 3Inoculum size/%
1.2.6 Statistical analyses
The model and formula were implemented using RSM. The values were evaluated as the mean of individual experiments in triplicate. The statistical significance was analyzed using student's test and regression. The data were fitted using the Expert Design 8.0.6 (SPSS Inc., USA) [27].
2.1 Process curve of alcoholicity and acidity during fermentation
During acetic acid fermentation, the increasing margin of acidity and reduction of alcoholicity are basically the same. Fundamental changes in acetic acid acidity and alcoholicity had trending negative correlations and were simply different in fermentation time and the rates of increase and decrease. From Fig.1, the magnitude of the changes in alcoholicity and the yield of acetic acid were not very large at the initial stage of fermentation. With the mounting of fermentation time,the alcoholicity diminished and acidity increased gradually. The main period of fermentation was between 24 h and 96 h,where the liquid material had the maximum margin, and the acidity rose quickly and alcoholicity declined rapidly. After 96 h, changes in alcoholicity and the yield of acetic acid tended to be smooth until the end of the study.
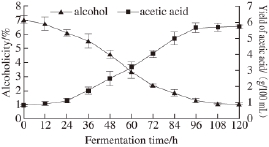
Fig.1 Changes in alcoholicity and yield of acetic acidity during acetic acid fermentation
2.2 Effect of temperature on acetic acid fermentation
As illustrated in Fig.2, the acetic acid content graduallyincreased in five pilot fermentation temperatures, but the trends differed from big to small. When fermented at temperatures of 28, 31 and 34 ℃, the acetic acid content was significantly higher than at the other tested temperature,and the maximum acidity reached 5.655 g/100 mL. When the temperature was 25 ℃, the acid-producing capacity was significantly weaker than at the other temperatures. This demonstrates that 25 ℃ is unsuitable for Acetobacter fermentation, as was 37 ℃. Therefore, 28, 31 and 34 ℃ were chosen as the temperatures for the RSM.

Fig.2 Effect of temperature on acetic acid fermentation
2.3 Effects of initial alcoholicity to acetic acid fermentation
Acetic a cid fermentation needs alcohol as reaction substrate. Under normal circumstances, acetic acid content increases with increasing alcoholicity, but at the same time,high alcoholicity inhibits the growth and metabolism of Acetobacter [20]. The results shown in Fig.3 indicate that acidity increases rapidly when the initial alcoholicity is 5%-8%, but when the acidity rises to a certain level, it will tend to flatten. The lowe r the alcoholicity, the earlier it tends to flatten. The Acetobacter began to be inhibited until it increased significantly 2 days later when the alcoholicity was at 9%. We can say that an alcoholicity of 7% is the best initial alcoholicity, and thus, we chose 6%, 7% and 8% for the three levels in the RSM.

Fig.3 Effect of initial alcoholicity on acetic acid fermentation
2.4 Effe ct of inoculum size on acetic acid fermentation
As demonstrated in Fig.4, at the initial stage of fermentation, the larger the inoculum size, the faster the fermentation and the greater the amount of acetic acid produced. The process would consume too many nutrients in fermentation broth in bacterial cell reproduction with too large an inoculum size. It would also produce a lot of metabolic waste and cause premature aging and autolysis in Acetobacter cells, thus leading to decreases in acetic acid.
With too low an inoculum size, the prophase fermentation speed would be too slow, fermentation would not be sufficient, and acid production would be reduced. Therefore,as shown in the figure, an inoculum size of 8%-12% is reasonable. Acetobacter inoculum size of 8%, 10% and 12% were selected as the three levels for the RSM.

Fig.4 Effect of inoculum size on acetic acid fermentation
2.5 Effect of shaking speed on acetic acid fermentation
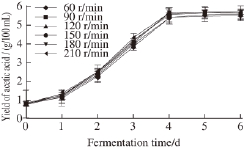
Fig.5 Effect of shaking speed on acetic acid fermentation
Acetic fermentation requires oxygen to oxidize ethanol and produce acetic acid. Increasing the amount of dissolved oxygen is one of the most important procedures in acetic acid fermentation. Increasing the shaking speed and liquidfilled volume can increase the amount of dissolved oxygen. In Fig.5, we see that the shaking speed plays a significant role in acetic acid fermentation. When the speed is too slow or too fast, the final acetic acid production is reduced. At a speed of 180 r/min, the yield of acetic acid reached a maximum of 5.72 g/100 mL. Thus, we selected 150, 180 and 210 r/min for the three levels.
2.6 Optimization of fermentation conditions
Based on the results of Box-Behnken Central composite design, the actual set of experiments performed are listed in Table 2.
Table 2 Box-Behnken design with experimental results of acetic acid fe rmentation
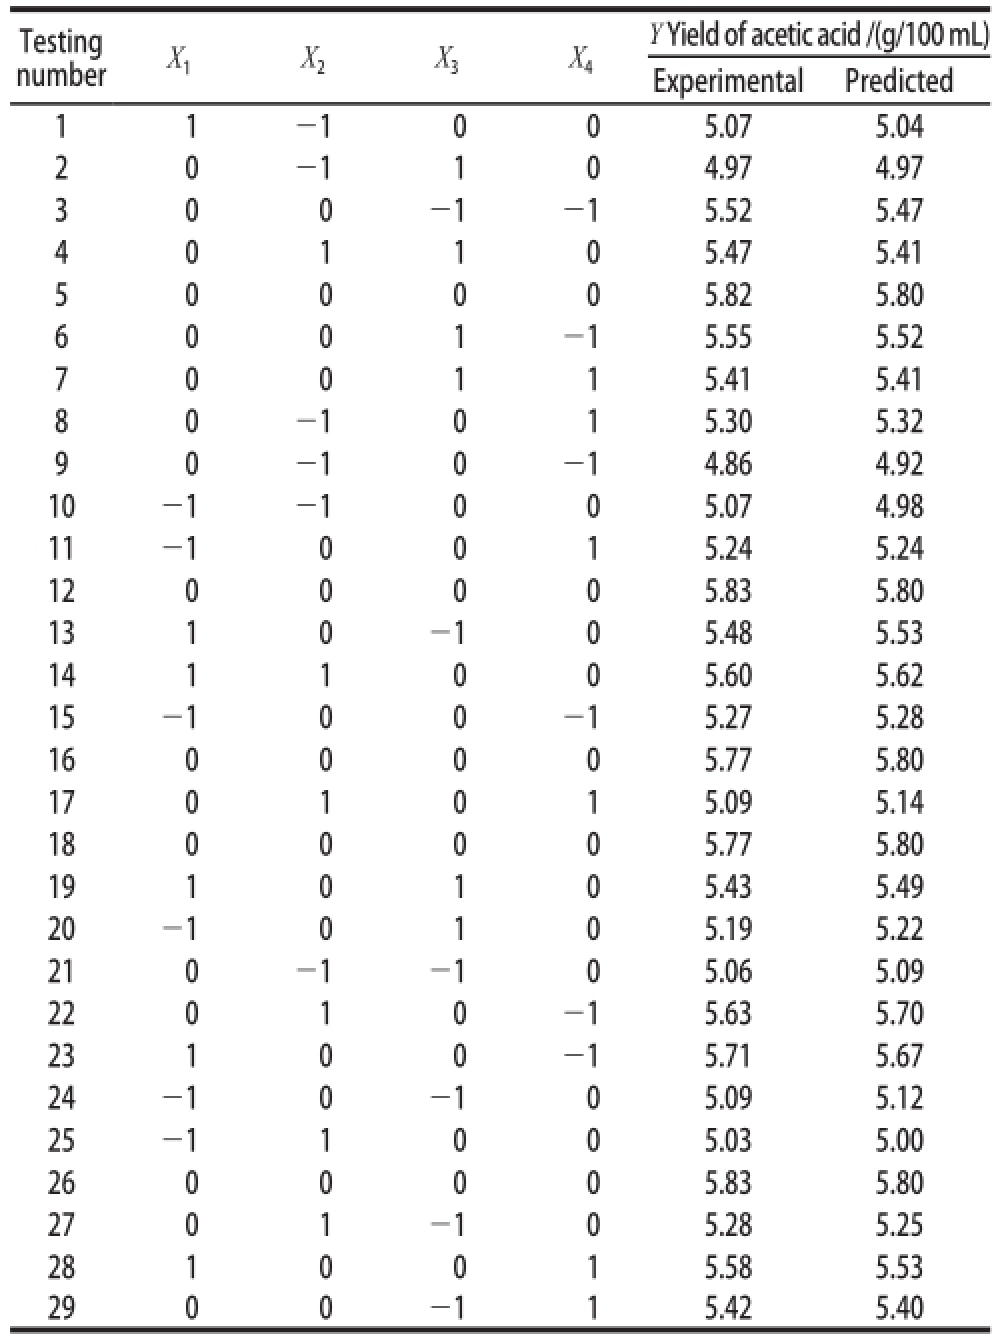
Testing number X 1 X 2 X 3 X 4Y Yield of acetic acid /(g/100 mL)Experimental Predicted 1 1 -1 0 0 5.07 5.04 2 0 -1 1 0 4.97 4.97 3 0 0 -1 -1 5.52 5.47 4 0 1 1 0 5.47 5.41 5 0 0 0 0 5.82 5.80 6 0 0 1 -1 5.55 5.52 7 0 0 1 1 5.41 5.41 8 0 -1 0 1 5.30 5.32 9 0 -1 0 -1 4.86 4.92 10 -1 -1 0 0 5.07 4.98 11 -1 0 0 1 5.24 5.24 12 0 0 0 0 5.83 5.80 13 1 0 -1 0 5.48 5.53 14 1 1 0 0 5.60 5.62 15 -1 0 0 -1 5.27 5.28 16 0 0 0 0 5.77 5.80 17 0 1 0 1 5.09 5.14 18 0 0 0 0 5.77 5.80 19 1 0 1 0 5.43 5.49 20 -1 0 1 0 5.19 5.22 21 0 -1 -1 0 5.06 5.09 22 0 1 0 -1 5.63 5.70 23 1 0 0 -1 5.71 5.67 24 -1 0 -1 0 5.09 5.12 25 -1 1 0 0 5.03 5.00 26 0 0 0 0 5.83 5.80 27 0 1 -1 0 5.28 5.25 28 1 0 0 1 5.58 5.53 29 0 0 -1 1 5.42 5.40
2.7 Model establishment and test of significance
Test data in Table 2 were analyzed using the statistics software Design-Expert 8.0.6 and the analysis of the regression model was used to establish the optimal values of the four factors. After the analysis, the regression model equation for the RSM was obtained for predicting Y based on
![]()
Y=5.80+0.
![]() +0.014
+0.014
![]() -0.042
-0.042
![]() + 0.14
+ 0.14
![]() -0.038
-0.038
![]() -0.025
-0.025
![]() +0.070
+0.070
![]() -0.24
-0.24
![]() -0.010
-0.010
![]() -0.24
-0.24
![]() -
-
![]() -
-
![]() -
-
![]()
Table 3 shows the significance of the linear relationship between the dependent variable and the independent variables. The model could account for 96.05% of the variance in the response value, which indicates a good fit of the model. The non-significance of the lack of fit showed that the quadratic regression equation could forecast the response value well. The significant terms of
![]()
![]() demonstrated that they could have a big influence on the response value. The results also suggest that the most important independent indices were the range of fermentation temperature (X
1), initial alcoholicity (X
2),inoculum size (X
3) and shaking speed (X
4), in that order.
demonstrated that they could have a big influence on the response value. The results also suggest that the most important independent indices were the range of fermentation temperature (X
1), initial alcoholicity (X
2),inoculum size (X
3) and shaking speed (X
4), in that order.
Table 3 Analysis of variance (ANOVA) for the response surface
regression model of acetic acid fermentation

Note: **. Extremely signifi cant difference at P<0.01; *. Signifi cant difference at P<0.05.
Source Sum of squares df Mean square F value Prob>F Significant Model 2.29 14 0.16 49.64 <0.000 1 ** X 1 0.33 1 0.33 99.05 <0.000 1 ** X 2 0.26 1 0.26 79.15 <0.000 1 ** X 3 2.408×10 -3 1 2.408×10 -3 0.73 0.407 2 X 4 0.021 1 0.021 6.32 0.024 8 * X 1X 2 0.081 1 0.081 24.63 0.000 2 ** X 1X 3 5.625×10 -3 1 5.625×10 -3 1.71 0.212 6 X 1X 4 2.500×10 -3 1 2.500×10 -3 0.76 0.398 7 X 2X 3 0.020 1 0.020 5.94 0.028 7 * X 2X 4 0.24 1 0.24 72.79 <0.000 1 ** X 3X 4 4.000×10 -4 1 4.000×10 -4 0.12 0.732 8 X 10.36 1 0.36 110.46 <0.000 1 ** X2 2 1.05 1 1.05 319.78 <0.000 1 ** X3 2 0.12 1 0.12 35.57 <0.000 1 ** Residual 0.046 14 3.298×10 -3Lack of fit 0.042 10 4.226×10 -3 4.31 0.085 9 Pure error 3.920×10 -3 4 9.800×10 -4Cor total 2.34 28 R 2 0.980 3 0.32 1 0.32 98.01 <0.000 1 ** X4 22 R2 Adj 0.960 5
2.8 Response surface methodology analysis and optimization
In order to estimate the fermentation factors, graphs were plotted of the influencing parameters. The response surface graph depicted by two out of three factors formed a series of approximate circles with one center regardless of diverse gradients; simultaneously, vaults hanging down took shape at the three-dimensional chart and reached the maximum.
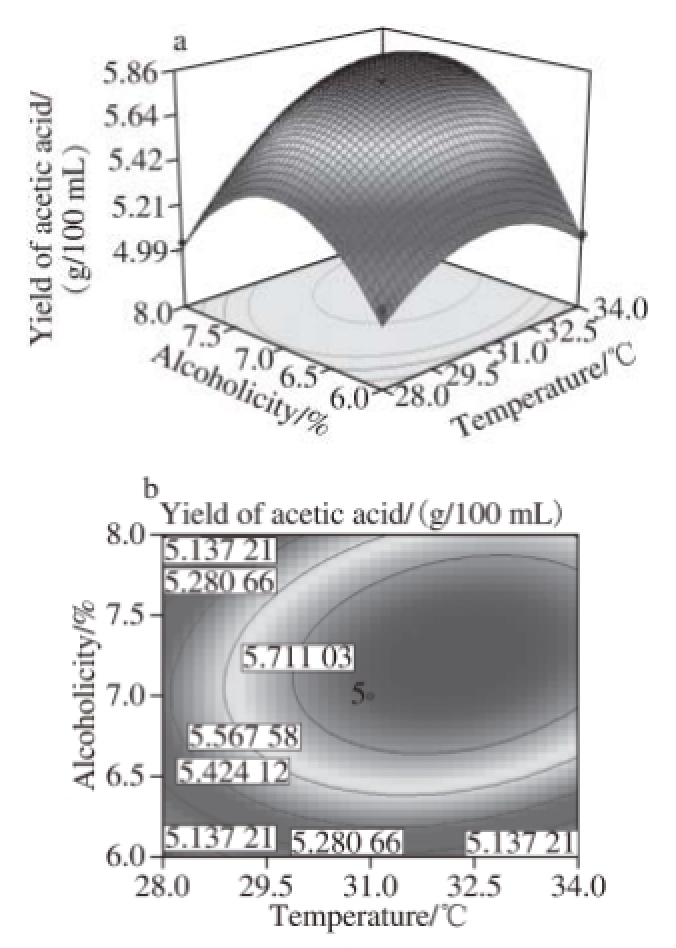
Fig..6 Response surface and contour plots for the effect of temperatureand alcoholicity on the yield of acetic acid

Fig.7 Response surface and contour plots for the effect of temperature and inoculum size on the yield of acetic acid
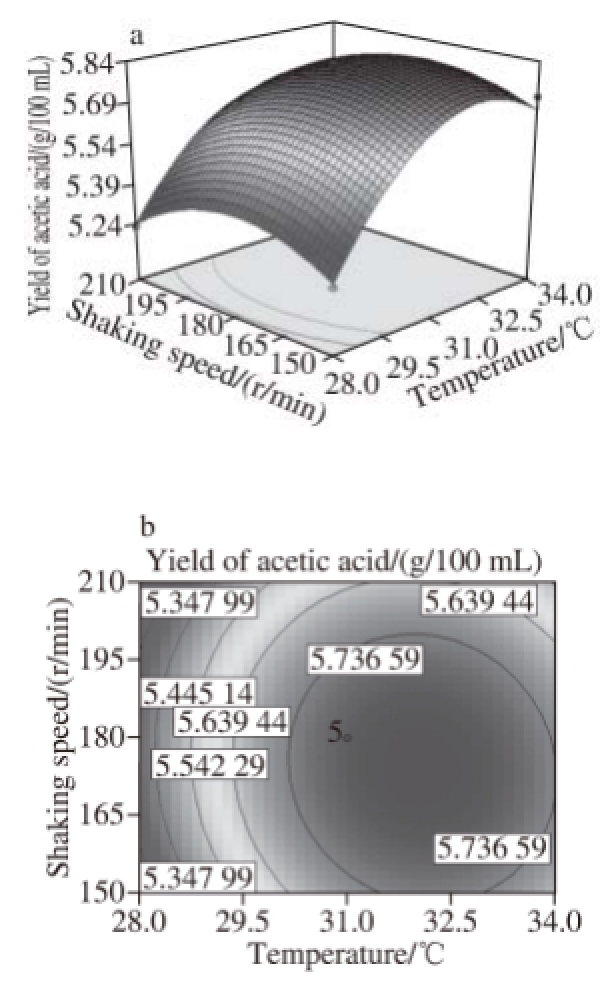
Fig.8 Response surface and contour plots for the effect of temperature and shaking speed on the yield of acetic acid
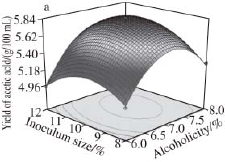
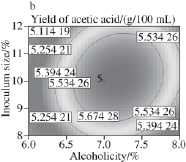
Fig.9 Response surface and contour plots for the effect of alcoholicity and inoculum size on the yield of acetic acid
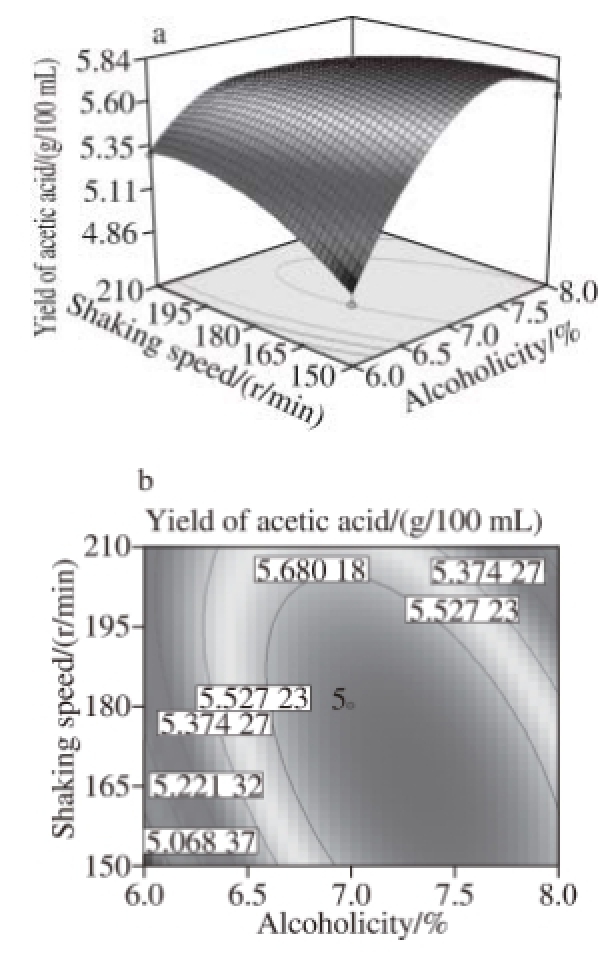
Fig.10 Response surface and contour plots for the effect of alcoholicity and shaking speed on the yield of acetic acid

Fig.11 Response surface and contour plots for the effect of inoculum size and shaking speed on the yield of acetic acid
Fig.6 to 11 show the interaction response surface between each pair of response values. We can see from the figures that the response value increases with the increase in fermentation factors. The response surface value decreases with the increase in the fermentation factors after the factors increase to the extreme value. As shown in Fi.6 and 7,in the interaction effects, initial X 1X 2and initial X 2X 4, have the maximum impact on the yield of acetic acid. This suggests that within the scope of the corresponding test level, we can control the temperature and shaking speed and increase the alcoholicity properly to improve the production of acetic acid.
In present study, RSM was used to determine the optimum process parameters that yield high acetic acid contents. Based on the single factor experiments and PBD (Plackett-Burman Design), the whole experiment acquired a satisfying result. This optimization results in a fermentation temperature of 32.575 ℃, an initial alcoholicity of 7.485%, an inoculum size of 10.16% and a shaking speed of 160.11 r/min. Considering the actual operation, the fermentation process parameters were amended to a fermentation temperature of 32.5 ℃, an initial alcoholicity of 7.5%, an inoculum size of 10% and a shaking speed of 160 r/min. Under these conditions, the mulberry fruit vinegar production achieved was 5.89 g/100 mL. In order to verify the reliability of the results, we carried out mulberry fruit vinegar fermentation using the optimized fermentation conditions. Three parallel tests were carried out,and the average actual measured acidity reached 5.85 g/100 mL. This model is anastomotic with the predictive model values and has a good effect on the practical applications.
With a fermentation temperature of 32.5 ℃, an initial alcoholicity of 7.5%, an inoculum size of 10% and a shaking speed of 160 r/min, we can obtain the optimal yield, and the mulberry fruit vinegar acidity can reach 5.85 g/100 mL. The quadratic linear regression model established in our experiment is accurate and effective and can be used to predict the conditions within and around the mulberry fruit vinegar processing parameters. Meanwhile,the predicted and experimental values were not significantly different. This suggested that the models obtained can be used to optimize the fermentation process of mulberry fruit vinegar. Mulberry fruit vinegar obtained from the fermentation is a nutritionally rich and healthy vinegar beverage and has broad market prospect.
References:nces
[1] YAO Fang, NI Wuzhong, YANG Xiaoe. Genotype resources and ecological adaptation of mulberry plants (Morus indica L.) and their application foreground[J]. Bulletin of Science and Technology, 2004,20(4): 289-292; 297.
[2] ERCISLI S, ORHAN E. Chemical composition of white (Morus alba)red ( Morus rubra) and black (Morus nigra) mulberry fruits[J]. Food Chemistry, 2007, 103(4): 1380-1384.
[3] WANG Chuyan, FAN Tao, GUI Zhongzheng, et al. The research and development of mulberry[J]. Food Industry, 2011, 174(3): 95-98.[4] OKI T, KOBAYASHI M, NAKAMURA T, et al. Changes in radic a l-scavenging activity and components of mulberry fruit during maturation[J]. Journal of Food Science, 2006, 71(1): 18-22.
[5] WANG Chuyan, LIU Yanwei, JIA Junqiang, et al. Optimization of fermentation process for preparation of mulberry fruit wine by response surface methodology[J]. African Journal of Microbiology Research, 2013, 7(3): 227-236.
[6] ERCISLI S. A short review of the fruit germplasm resources of Turkey[J]. Genetic Resources and Crop Evolution, 2004, 51(4): 419-435.
[7] COSTA A O, THOMAZ-SOCCOL V, PAULINO R C, et al. Effect of vinegar on the viability of Giardia duodenalis cysts[J]. International Journal of Food M icrobiology, 2009, 128(3): 510-512.
[8] JAFARI A A, FALAH-TAFTI A, HOSSEIN M, et al. Vinegar as a remo ving agent of Candida albicans from acrylic resin plates[J]. Jundishapur Journal of Microbiology, 2012, 5(2): 388-392.
[9] KUDA T, YAZAKI T, TAKAHASHI H, et al. Effect of dried a nd vinegar flavored squid products on acid resistance of Salmonella typhimurium and Staphylococcus[J]. Food Control, 2013, 30(2): 569-574.
[10] GONZ.LEZ A, GUILLAM.N J, MAS A, et al. Application of mol e cular methods for routine identification of acetic acid bacteria[J]. International Journal of Food Microbiology, 2006, 108(1): 141-146.
[11] CLEENWERCK I, DEVOS P. Polyphasic taxonomy of acetic acid bacteria: an overview of the currently applied methodology[J]. International Journal of Food Microbiology, 2008, 125(1): 2-14.
[12] GULLO M, CAGGIA C, DEVERO L, et al. Characterization o f acetic acid bacteria in traditional balsamic vinegar[J]. International Journal of Food Microbiology, 2006, 106(2): 209-212.
[13] MARIETTE I, SCHWARZ E, VOGEL R F, et al. Characterization b y plasmid profile analysis of acetic acid bacteria from wine spirit and cider acetators for industrial vinegar production[J]. Journal of Applied Microbiology, 1991, 71(2): 134-138.
[14] HORIUCHIA J, TADAA K, KOBAYASHI M, et al. Biological approach for effective utilization of worthless onions vinegar production and composting[J]. Resources, Conservation and Recycling, 2004, 40(2): 97-109.
[15] GUERRERO M I, HERCE-PAGLIAI C, CAMEAN A M, et al. Multivariate charac terization of wine vinegars from the south of Spain according to their metallic content[J]. Talanta, 1997, 45(2): 379-386.
[16] MALDONADO O, ROLZ C, CABRERA S S. Wine and vinegar pr oduction from tropical fruits[J]. Journal of Food Science, 1975,40(2): 262-265.
[17] YU Zheng, ZHANG Keping, WANG Chunxia, et al. Improving acetic ac id production of Acetobacter pasteurianus AC2005 in hawthorn vinegar fermentation by using beer for seed culture[J]. International Journal of Food Science and Technology, 2010, 45(11): 2394-2399.
[18] GULLO M, GIUDICI P. Acetic acid bacteri a in traditional balsamic vinegar, phenotypic traits relevant for starter cultures selection[J]. International Journal of Food Microbiology, 2008, 12(5): 46-53.
[19] TRCEK J, RASPOR P, TEUBER M. Molecular identific ation of Acetobacter isolates from submerged vinegar production, sequence analysis of plasmid pJK2-1 and application in the development of a cloning vector[J]. Applied Microbiology & Biotechnology, 2000,53(3): 289-295.
[20] BERRAUD C. Production of highl y concentrated vinegar in fed-batch culture[J]. Biotechnology Letters, 2000, 22: 451-454.
[21] LIU Jun, HU Huiren, XU Juanfeng, et al. Optimizing enzymati c pretreatment of recycled fiber to improve its draining ability using response surface methodology[J]. Bioresources, 2012,7(2): 2121-2140.
[22] CHEN Chunxu, CHEN Fusheng. Study on the condit ions to brew rice vinegar with high content of γ-amino butyric acid by response surface methodology[J]. Food and Bioproducts Processing, 2009, 87(4): 334-340.[23] GAN Chenyuen, LATIFF A. Optimization of the solvent extraction of bioactive compounds from Parkia speciosa pod using response surface methodology[J]. Food Chemistry, 2011, 124(3): 1277-1283.
[24] HAJJI M, REBAI A, GHARSALLAH N, et al. Optimization of alk aline protease production by Aspergillus clavatus ES1 in Mirabilis jalapa tuber powder using statistical experimental design[J]. Applied Microbiology and Biotechnology, 2008, 79(6): 915-923.
[25] OZER E A, İBANOĞLU S, AINSWORTH P, et al. Expansion characterist ics of a nutritious extruded snack food using response surface methodology[J]. European Food Research and Technology,2004, 218(5): 474-479.
[26] General Administration of Quality Supervision. GB/T 5009.41—2003 Method of analysis of h ygienic standard of vinegar[S]. Beijing:Inspection and Quarantine of PR China. 2003.
[27] PAN Wenjuan, LIAO Aimei, ZHANG Jianguo, et al. Supercritical carbon di oxide extraction of the oak silkworm (Antheraea pernyi)pupal oil: process optimization and composition determination[J]. International Journal of Molecular Sciences, 2012, 13(2): 2354-2367.
响应面法优化桑椹果醋的发酵工艺
王储炎 1,2,范 涛 2,胡庆国 1,许晨晨 1,陈 晨 1
(1.合肥学院生物与环境工程系,安徽 合肥 230601;2.安徽省农业科学院蚕桑研究所,安徽 合肥 230061)
摘 要:果醋加工中最关键的环节是通过发酵酒精产生醋酸。现有资料表明醋酸菌菌种、发酵环境和初始酒精体积分数影响着醋酸产量。本研究以桑椹果酒作为发酵原料,从江苏恒顺醋厂醋醅中分离出的巴氏醋杆菌W6作为发酵菌种,采用响应面法优化桑椹果醋的发酵参数。实验结果表明,桑椹果醋的最优发酵条件为发酵温度32.5 ℃,初始乙醇体积分数7.5%,接种量10%(V/V),转速160 r/min。在此优化条件下,桑椹果醋酸度可达到5.85 g/100 mL。实验证实W6菌株具有很强的产醋酸能力。
关键词:桑椹果醋;醋酸菌;发酵条件;响应面分析
中图分类号:TS255.47
文献标志码:A
文章编号:1002-6630(2015)23-0233-08
收稿日期:2015-02-09
基金项目:合肥学院人才科研基金项目(14RC03)
作者简介:王储炎(1982—),男,讲师,博士,研究方向为食品加工。E-mail:honghuyan@sina.com
doi:10.7506/spkx1002-6630-201523043