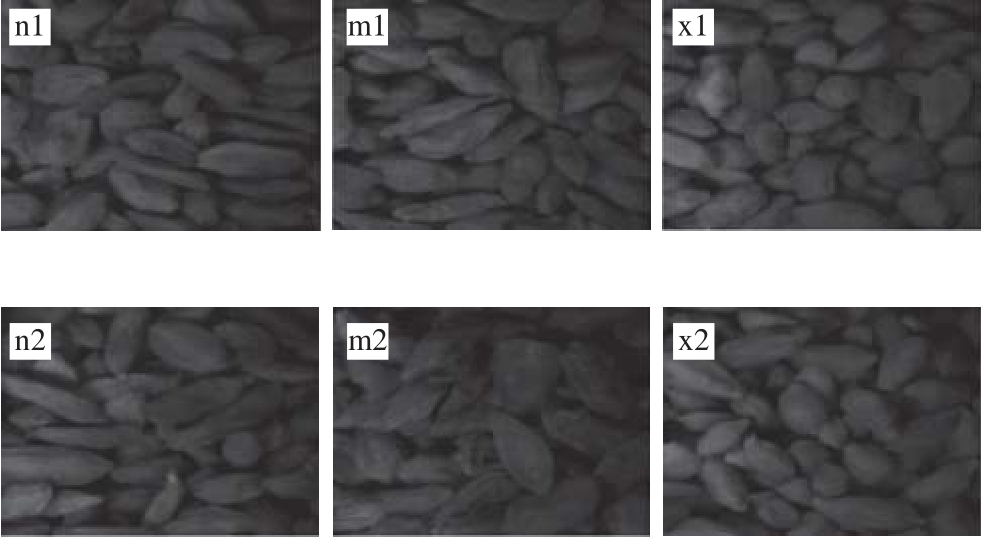
Fig. 1 Images of six groups of wolfberry samples
YU Huichun, WANG Runbo, YIN Yong*, LIU Yunhong
(College of Food and Bioengineering, Henan University of Science and Technology, Luoyang 471023, China)
Abstract: In order to obtain the best hyperspectral characteristic wavelength for wolfberry grading, a feature wavelength selection method for hyperspectral image analysis based on information entropy was presented. Under different wavelengths,fi rstly, the self-information of each sample image was calculated, and the mean self-information of hyperspectral images of each class of wolfberry was calculated; secondly, the mutual information between two arbitrary sample classes was calculated to obtain the mean mutual information between the corresponding hyperspectral images. Furthermore, the ratio of the mean mutual information to the sum of the mean self-information which corresponded to each sample class under a certain wavelength was calculated and defi ned as A. Finally, it was found that A value could be taken as a quantitative index to select the optimal hyperspectral image wavelength for wolfberry grading. The analytical results showed that t he optimal wavelength was 950 nm. Then the texture features of all wolfberry samples under the selected wavelength were extracted,and Fisher discriminant analysis ( FDA) was employed to classify six classes of wolfberries for the purpose of verifi cation.The results of this study showed that wavelength selection of hyperspectral image analysis based on information entropy is highly feasible for wolfberry grading.
Key words: hyperspectral image; information entropy; optimal wavelength; wolfberry; classifi cation
Wolfberry is rich in polysaccharides, carotenoids, betaine and any other functional ingredients. It has the functions of promoting metabolism, scavenging free radicals, reducing blood sugar and blood fat, and possesses anti-cancer and other functions[1-3]. However, there are significant differences in the quality of wolfberry in different grades, thus, it is very important to detect the quality of wolfb erry of different grades.
Nowadays, several manual methods have been applied to detecting wolfberry quality. However, they are easily influenced by subjective emotion and lead to inaccuracy classification. In sensory evaluation method, the typical indexes to evaluate the quality of the wolfberry are color, size and shape[4]. However, in order to pose as superior wolfberry,some farmers frequently add some chemical reagents to improve the color brightness. In addition, although the physical and chemical detection method is accurate, the operation is tedious, time-consuming and laborious.
Hyperspectral imaging technique is the integration of machine vision technique and s pectroscopy technique,acquiring simultaneously both spatial inf ormation and spectral information. It can be used to detect the internal and external quality of agricultural products. Hyperspectral imaging technique has been a major development tendency in the non-destructive detection of the quality of agricultural products[5-10]recently. The technique has been successfully reported as an intelligent tool for quality and safety assessment of products, such as tobaccos[11], tea leaves[12], vegetables[13], fruit[14-15], meat[16-17], milk powder[18], egg[19], and nut[20]and so on. H owever, hyperspectral technique has its limitations, mainly because the hyperspectral image contains thousands of continuous bands from the visible to near infrared, resulting in large amounts of redundant information[21].Thus, it is necessary to select the optimal wavelength from the thousands of bands, acquiring the best image to analyze.Therefore, the study on the selecting method of optimal wavelength is particularly important.
At present, the main selecting methods of optimal wavelength about hyperspectral image are principal component analysis (PCA)[22]and independent component analysis (ICA)[23]. However, there is no research on whether the selected principal component and independent component are optimal. Besides, the components are not alw ays ideal.So there is certain inaccuracy to choose optimal wavelength,therefore, affecting subsequent processes.
In the theory of information, entropy expresses the complexity or uncertainty of a system, and on the average sense it is also a metric of the amount of information contained in the source[24]. Referencing the analysis method of the gray image, the probability of occurrence about pixels with different gray levels is independent of each other in the image, therefore the gray scale of the hyperspectral im age can be regarded as a rando m variable. Then the information entropy of the hyperspectral imag e is calculated. Information entropy can be divided into self-information and mutual information. Comparing with self-information, mutual information is a metric derived from Shannon’s information theory to estimate the information content gained from observation s of one random variable on anot her[25], and can describe the relevance between two random events[26]. They have been widely used in evaluation of image qualit y[27].For hyperspectral images of two different wavelengths, the higher the self-information is, the richer the inf ormation contained in the hyperspectral image is. The smaller the mutual information is, the smaller the relation between the two images is, and the bigger the difference between the two hyperspectral images is. Therefore, it is more conducive to classify when self-information is at the maximum an d mutual information between the images is at the minim um.Based on the above ideas, in this research, we developed a quantitative method of selecting optimal wavelength based on information entropy.
In this research, 180 wolfberry samples were taken as investigation objects, and they were scanned by the acquisition system of hyp erspectral image. Then the hyperspectral images under all the wavelengths wer e acquired, and the images under different wavelengths ca n be analyzed. Under the s pecial wavelengths, the mean selfinformation in each kind of wolfberry hyperspectral images and the mean mutual i nformation between any two kinds of wolfberry hyperspectral images were calculated. Furthermore,the ratio of the mean mutual information to the sum of the two mean self-information which correspond to the two grades of samples under one wavelength was acquired.Finally, this value can be regarded as a quantized evaluation index to select the hyperspectral image optimal wavelength for wolfberry grading, and this method was proved to be right by FDA. The new method proposed to select the optimal wavelength of hyperspectral image could provide a reference value for classifying wolfberry.
1.1 Materials
The dried wolfberrys were collected from Ningxia, Inner Mongolia and Xinjiang. Two grades sorted according to size and color were selected from each place respectively. In total,there were six kinds of wolfberry, and 30 samples for each kind. Namely, Ningxia Acura fruit (n1), Ningxia Teyou (n2),Inner Mongolia Acura fruit (m1), Inner Mongolia Teyou (m2),Xinjia ng Acura fruit (x1), and Xinjiang Teyou (x2). The redgreen-blue (RGB) images of six kinds of wolfberry were shown in Fig. 1.
Fig. 1 Images of six groups of wolfberry samples
1.2 Methods
1.2.1 Hyperspectral imaging system and image acquisition
The acquisition system of hyperspectral image used in the experiment mainly is consisted of a line-scanning imaging spectrograph (Inno-Spec IST50—3810), an illumination unit (Germany ESYLUX 90000420108), a transmission device and a computer with image acquisition software.Hyperspectral imager connected to the computer by USB 2.0 was applied to record and store hyperspectral data timely.Fore halogen lamp of 500 W were used to provide suffi cient light source. Fig. 2 showed the acquisition system of hyperspectral image. In order to obtain each pixe l of ima ges under all the wavelengths for the samples, the pattern with a linear array detector was utilized in this work. At the same time, along with the running of the conveyor belt, the linear array detector scanned the whole plane, and completed the collection of the desired area. Hyperspectral images were generated in the spectral range of 371.05-1 023.82 nm with 0.49-0.51 nm intervals, producing a total of 1 288 spectral bands. The spectral resolution was 2.8 nm, and the exposure time for each hyperspectral image was set as 56 ms.When acquiring images by the acquisition system,wolfberry (40 ± 0.5) g was weighted as a sample and tiled on a petri dish uniformly. And the petri dish was placed on a conveyor belt, whose speed was 1.25 mm/s. Then the scanning rang e of the hyperspectral image was set to 520 × 1 032 pixels. Therefore, a three-dimensional hypercube with spatial information (520 × 1 032 pixels) and spectral information (1 288 nm wavelength) were generated for each sample. In the experiment, 30 samples were tested for each kind of wolf berry, and altogether 180 samples were tested for 6 kinds of wolfberry. Then ENVI 4.7 (Research Systems Inc., Boulder, CO, USA) and Matlab R2014a(The Math Works Inc., USA) were used to process subsequent data.
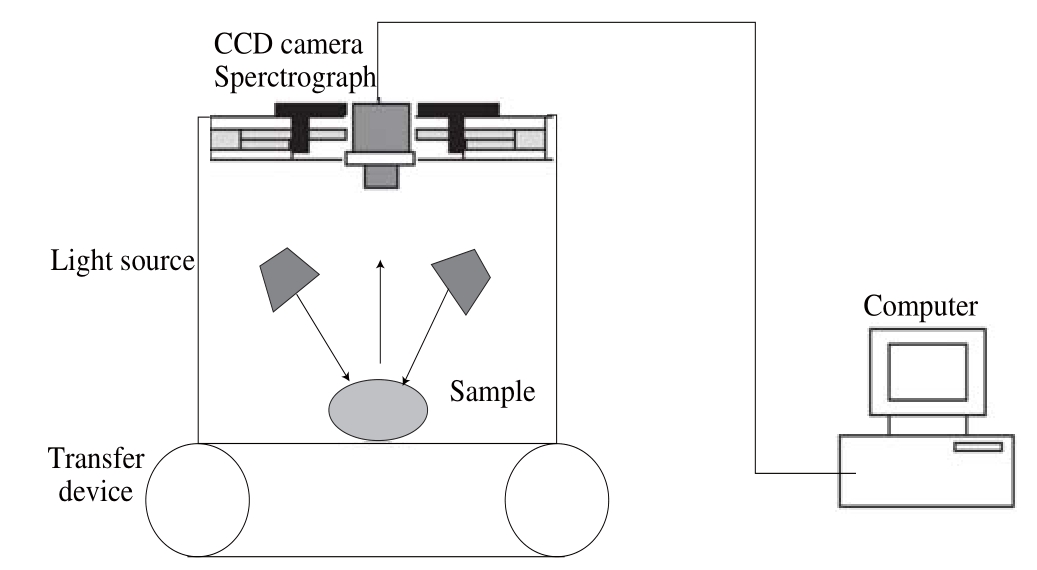
Fi g. 2 Schematic of the acquisition system of hyperspectral image
1.2.2 The calibration of hyperspectral image
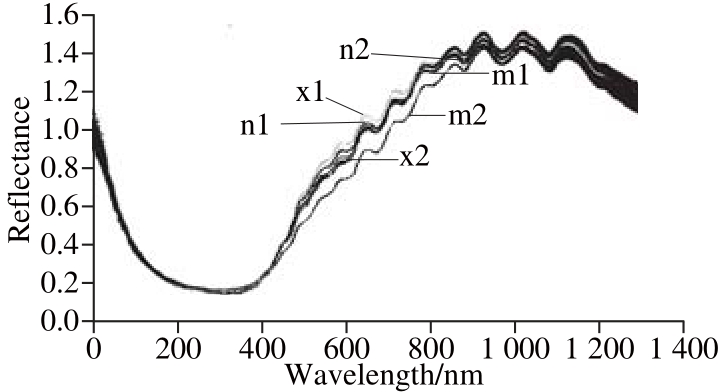
Fig. 3 Me an spectra of wolfberry samples in the wavelength range of 0–1 288 nm
Because the intensity of the light source in each band is not uniform, it leads to some noise in the image. Therefore,it is necessary to calibrate the hyperspectral image. The white reference image and dark reference image should be acquired under the same experimental conditions as image correction. The dark reference image is obtained by covering the camera lens completely, and the white reference image is acquired by scanning a standard white board. The calibration of hyperspectral image is completed by the Eq. (1). The meanrelative refl ectance spectra of six kinds of wolfber ry samples after calibration are shown in Fig. 3.
Where C is the corrected image; R is the raw imag e; W is the white reference image; and D is the dark reference image.
1.2.3 Texture features extraction
The rough surface and the obvious texture are the main characteristic of wolfberry. Thus, the texture features of different kinds of wolfberry will show some differences.Therefore, this research extracted the texture features of specific hyperspectral images as the characterization of wolfberry. Before extracting, the feature and the hyperspectral images must be pretreated to eliminate the influence of shadow and gap among the wolfberry, which was scattered in the petri dish uniform ly.
Gray-level co-occurrence matrix (GLCM) is an effectiv e statistic technique for texture analy sis. Specifically, GLCM is an estimate of joint probability density function of gray level pairs, that is, it calculates the probability that a pixel of particular gray level occurs at a specified direction and distance from its neighbori ng pixels[28]. In this study, the function of “graycomatrix” in Matlab R2014a was use d,and four feature vectors (contrast, correlation, energy and homogeneity) were calculated from the gray co-occurrence matrix with the angles of 0°, 45°, 90°, 135° and distance of 1 pixels.
Then the function of “statxture” in Matlab R2014a was also adopted to calculate some texture descriptor based on brightness histogram in the area, such as the mean (average brightness), standard deviation (average contrast), smoothness(relative smoothness of brightness in the area), three moments(skewness histogram), consistency (consistency) and entropy(randomness).
Finally, 22 texture features were extracted from the hyperspectral image at any wavelength.
1.2.4 Fisher discriminant analysis (FDA)
The b asic idea of Fisher discriminant analysis (FDA) is the projection, fi nding a transformation matrix that maximizes the between-class scatter and minimizes the within-class scatter simultaneously[29]. The projection directions are selected by the cumulative discrimination of discriminant function. The fi rst fi ve discriminant functions were selected in this study. The between-class matrix and within-class matrix are given as follows∶

In formula∶ A is the group dispersion matrix; B is the difference matrix between groups; X(jt)is the j sample in the class of t;(t)is the mean value about the class of t sample;and is the mean value of all the samples.
1.2.5 Information entropy of image
Entropy is an important concept from Shannons information theory[30]. For the wolfberry hyperspectr al images, according to the gray scale information, the probability distribution of each gray level can be calculated by the formula∶ P(i)=h(i)/n. Where, i is the gray value, and h(i) is the total number of the pixel whose gray value is i,and n is the number of all the pixels in the image, and P(i)is the probability distribution whose gray value is i. Then the self-information of M and N is calculated respectively according to the Equations (4) and (5). In the process o f im age processing, mutual information measures the amount of informa tion that is shared betwe en image M and N[31-32],assuming PM,N(i,j) represents the joint probability density of M and N. The joint entropy of M and N can be expressed as the Eq. (6). Thus the mutual information of M and N can be given as the Eq. (7).
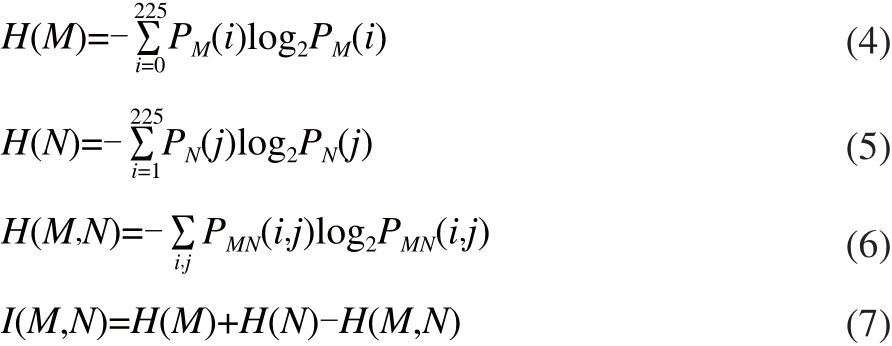
In formulas∶ M or N is a hyperspectral image at the special wav elength, PM(i) or PN(j) is respectively the probability distribution of a gray level about M or N, PMN(i,j)is the joint probability distribution of two hyperspectral images, H(M) or H(N) is the self-information of M or N,I(M,N) is the mutual information.
1.2.6 The defi nition of A
The self-information of each hyperspectral image reflects the amount of image information, and the mutu a l information between different hyperspectral im ages refl ects the amount of the overlapping information. Therefore, the greater the self-information is and the smaller the mutual information is, the greater the dif ference is between the wolfberry hyperspectral images, and then the more conducive to distinguish the different kinds of wolfberry. Then a method of selecting optimal wa velength of hyperspectral image basedon the inf ormation entropy has been put forwarded. The formula of calculation is as the Equations (8)-(11).
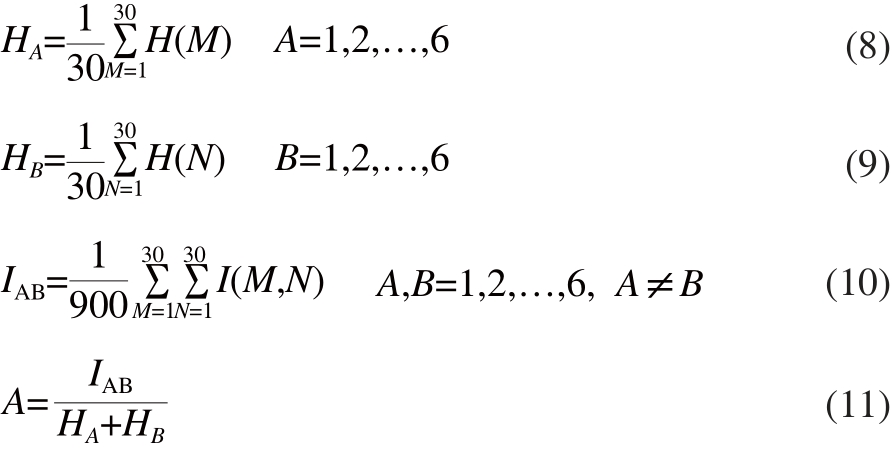
Where, HAor HBwas the mean self-information of all samples about a kind of wolfberry hyperspectral images at a wavelength; I(M,N) was the mutual information between two sample images which came from two kinds of w olfberry samples respectively; IABwas the mean mutual informati on between two kinds of wolfberry hyperspectral images at a wavelength, every kind wolfberry had 30 samples, so the number of the combination for two kinds of wo l fberry was 900.
Under each wavelength, the wolfberry hyperspectral ima ges were a nalyzed using the abo ve method. Ther efore, the value of A was obtained a t any wavelength. Then the different results of A were obtained and they were sorted according to the size. The smaller the value of A was, the more favorable classifying dif ferent kinds of wolfberry was. Namely, the wavelength corresponding to the minimal value of A was the optimal wavelength.
2.1 Preliminary screening of the range of optimal wavelength
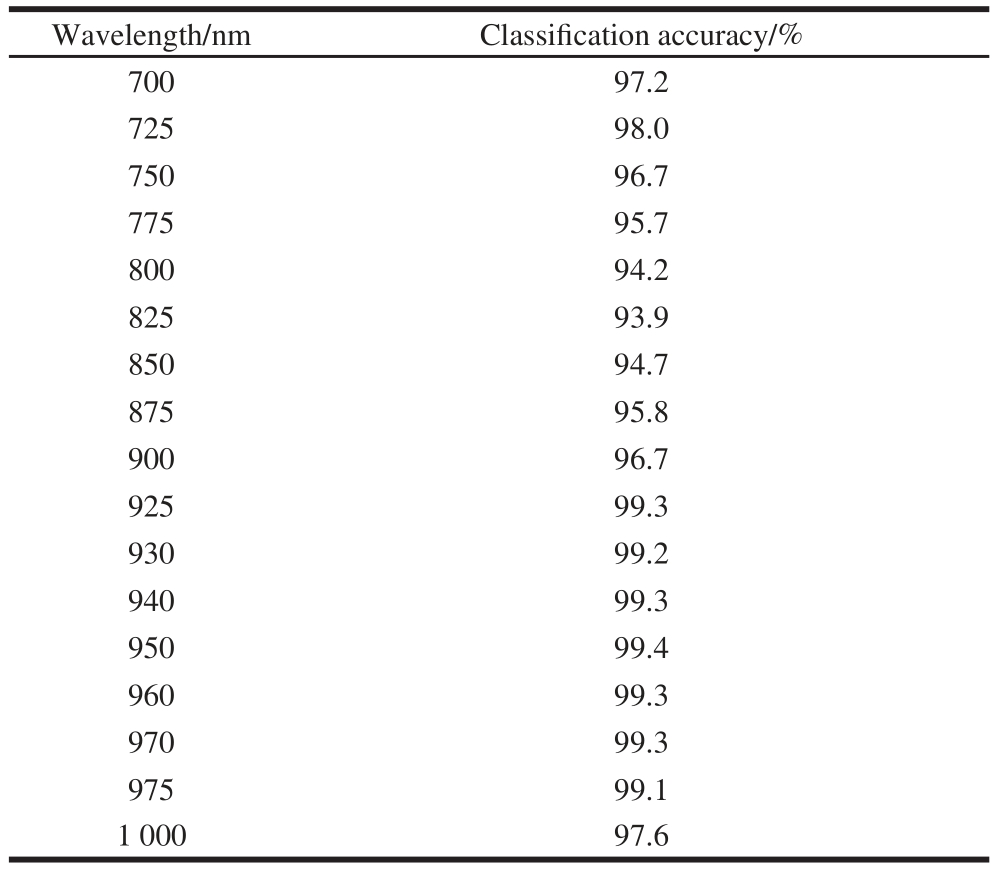
The hyperspectral imaging system covers two spectral ranges, i.e. he vis ible light band of 371.05-780 nm and the near infrared spectral band of 780-1 023.82 nm. For each sample, there were 1 288 images under continuous narrow bands. So the amount of data was ext remely huge. In order to reduce the amount o f calcul ation, six wavelengths at the interval of 100 nm were selected from the whole bands.Namely, they were 450, 550, 650, 750, 850 nm and 950 nm,respectively. This was a rough c hoice, and this showed the band range which was conducive to classification. Firstly,twenty two texture features were extracted from the images at the six wavelengths. Secondly, FDA was used to build classifi cation models on the whole features. The class ifi cation accuracy of 6 samples under the six wavelengths were shown in Table 1.
Table 1 Classifi cation accuracy of samples under six wavelengths
Table 1 showed that the classification accuracy of wolfberry under the six wavelengths presents increasing trend. By comparison, FDA models about hyperspectral images at 950 nm perform best with the classification accuracy of 99.4%. The results indicate that the hyperspectral image under near infrared bands shows advantages on classifying wolfberry. Thus, the optimal wavelength should be in the near infrared band. Further, information entropy of hyperspectral images under near infrared band should be analyzed carefully to determine the optimal wavelength.
2.2 Determination of optimal wavelength based on the value of A
Within the band of 700-1 000 nm, a wavelength was selected every 25 nm interval. Thus, 13 wavelengths were selected. The mean self-information of each kind sample under the 13 wavelengths were calculated by the Equations (8)and (9). The results were shown in Fig. 4a.
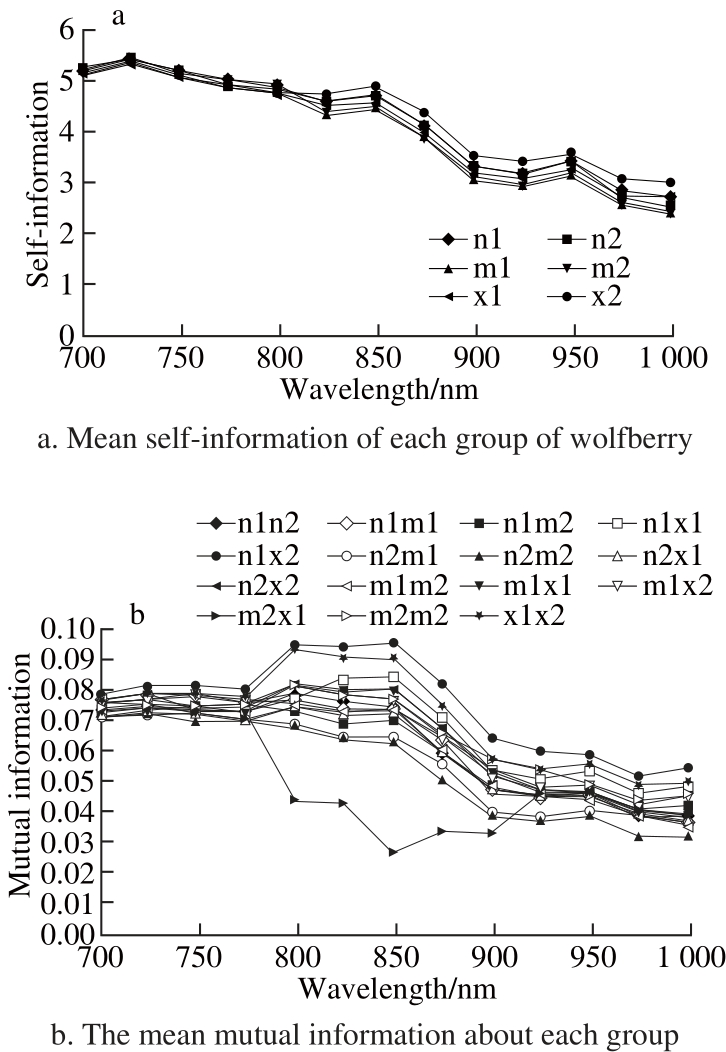
Fig. 4 Mean self-information and mean mutual information under 13 wavelengths
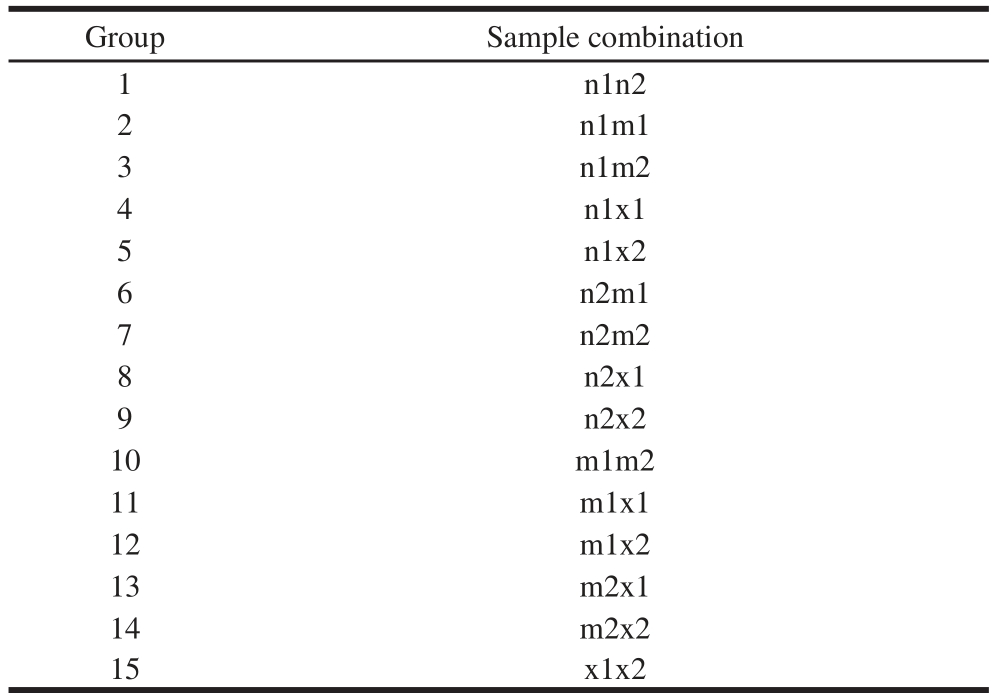
In Fig. 4a, t he change trend of the mean self-information at different wavelengths is basically identical. Obviously, t he self-information of hy perspectral image is maximum of 5.51 at 725 nm, wh ich means that the amount of self-information contained in the hyperspectral image is more comprehensive,b u t this self-information may also contain redundant information. Therefore, t he mu tual information between any two kinds needed to be calculated at the 13 wavelengths. In order to calculate the mutual information between any two kinds, the six kinds of samples were combined randomly.Thus, 15 combinations were gotten, as shown in Table 2.
Table 2 Combinations of six groups of wolfberry samples
The mutual information of each group under different wavelengths was calculated by the Eq. (10), and the results were shown in Fig. 4b.
It can be seen from Fig. 4b that t he change trend of the mean mutual information at different wavelengths increases fi rstly and then decreases, except for m2x1. The mean mutual information is much smaller at 875-1 000 nm bands, and the mean mutual information is smallest at 975 nm as for each group. This means that the related information between any two kinds of wolfberry samples is smaller at 975 nm.
According to Fig. 4a and Fig. 4b, the self-information about the sample is larger at the wavelength of 725 nm, but the mutual information is also larger. It means that there are more redundant information in itself, and it is not conducive to grade. When at the wavelength of 975 nm, although mutual information of each group is minimal, the self-information of each kind of wolfberry image is also smaller, so it is not favorable to classify either.
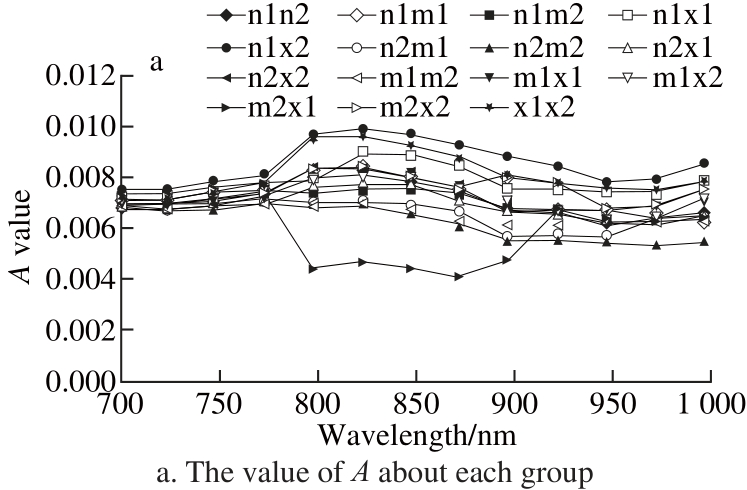
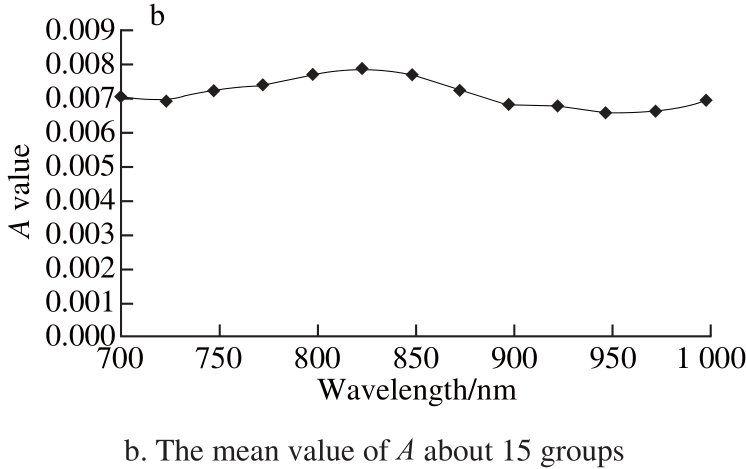
Fig. 5 A values of each group and mean A values of 15 groups under 13 wavelengths
According to the Eq. (11), the values of A about 15 groups we re calculated, respectively, at 13 wavelengths,an d the results were shown in Fig. 5a. The value of A is the smallest of all at 950 nm for each group. That is, t he amount of self-information about the hyperspectral image is more abundant, and the overlapping information is smaller between any two kinds of samples. It means that the correlation between different kinds of wolfberry is relatively small. Th us,it is more benefi cial to classifi cation. The mean values of A about 15 groups under this 13 wavelengths were calculated,respectively, and the results were shown in Fig. 5b.
From Fig. 5b, the mean value of A of 15 groups at 950 nm is minimum of 0.006 547. In order to see the further change of information entropy near the wavelength of 950 nm, fo ur wavelengths were selected at the interval of 10 nm around 950 nm, namely, 930, 940, 950, 960 nm and 970 nm. The mean values of A were calculated at the 5 bands and shown in Fig. 6.
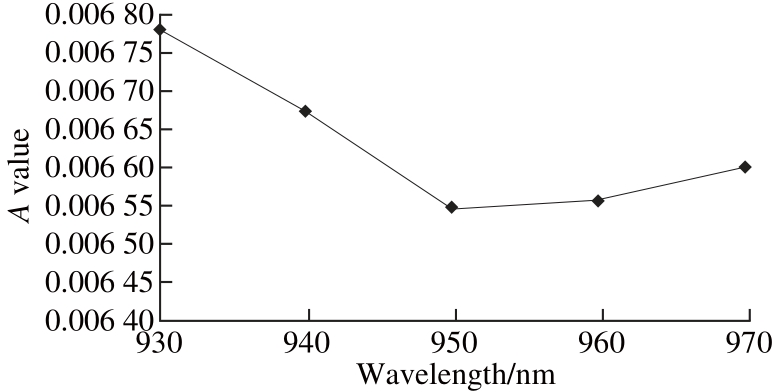
Fig. 6 Mean A values of 15 groups under 5 wavelengths
As shown in Fig. 6, the value of A is very close, and the mean value of A for all the samples at 950 nm is the smallest one. So it is considered that 950 nm is the optimal wavelength of hyperspectral images for wolfberry grading.
2.3 Validation by FDA
In order to verify the method of selecting optimal wavelength for cla ssifying wolfberry, twe nty two texture features of the hyperspectral images under the special wavelengths were extracted, and FDA was adopted to classifythe six kinds of wolfberry samples at the above wavelengths.The classifi cation accuracy of wolfberry is shown in Table 3.
Table 3 Classifi cation accuracy under seventeen wavelengths
According to Fig. 6 and the Table 3, it is shown that the classifi cation accuracy is consistent with the value of A.Besides, classification accuracy of the hyperspectral image about wolfberry at 925-975 nm is nearly identical, and the difference of A at 925-975 nm is very small (<0.000 3). So it is reasonable that the wavelength corresponding to the minimum value of A is regarded as optimal one. Finally,FDA was employed to classify the six kinds of wolfberries and verify the result. The correct classifi cation rate about six types of wolfberry was 99.4%, and the cross validation rate was 94.5%. The two dimension classification effect of the hyperspectral image about wolfberry at 950 nm by FDA is shown in Fig. 7.
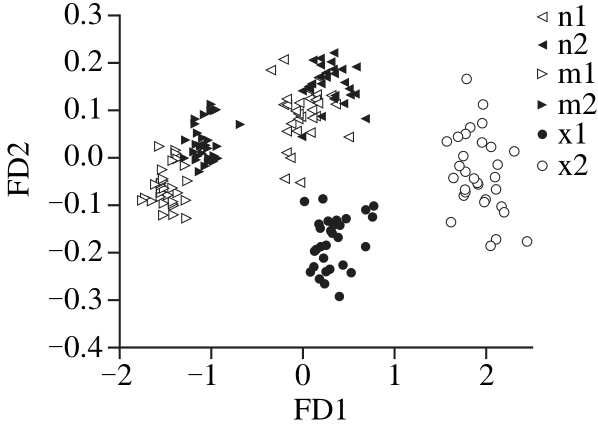
Fig. 7 FDA results of wolfberry hyperspectral image under 950 nm
It can be seen from Fig. 7 that the wolfberries of different areas are separated obviously from each other. I t shows that the differences between wolfberry of different places are great. A s for different grades in the same origin,the two grades in Xinjiang have a clear boundary, and the boundary of the two wolfberry samples from Inner Mongolia is close, but not mixed. On ly less overlap appeared between the two grades in Ningxia. The result shows that the difference between the two grades of Ningxia wolfberry is small, and the quality of wolfberry in Xinjiang has a big difference. In total, the six kinds of wolfberry can be classifi ed by FDA.
This research took the use of self-information and mutual information of the hyperspectral image and proposed a selection method of hyperspectral image optimal wavelength for wolfberry classification. Th e wavelength of 950 nm has been defined as the op timal wavelength of the wolfberry hyperspectral images by this method. Furthermore,cl assification accuracy of wolfberry hyperspectral image at 950 nm was verified by FDA. The classification accuracy rate has reached 99.4%, and the cross validation rate reached 94.5%. I t has been proven that the selection method of optimal wavelength based on information entropy about the hyperspectral image is feasible. Th is study provides a new method for selecting optimal wavelength in hyperspectral image technique.
[1] AMAGASE H, FARNSWORTH N R. A review of botanical characteristics, phytochemistry, clinical relevance in efficacy and safety of Lycium barbarum fruit (Goji)[J]. Food Research International,2011, 44(7)∶ 1702-1717. DOI∶10.1016/j.foodres.2011.03.027.
[2] LUO Q, LI Z, YAN J, et al. Lycium barbarum polysaccharides induce apoptosis in human prostate cancer cells and inhibits prostate cancer growth in a xenograft mouse model of human prostate cancer[J].Journal of Medicinal Food, 2009, 12(4)∶ 695-703. DOI∶10.3321/j.issn∶0512-7955.2008.01.017.
[3] REEVE V E, ALLANSON M, ANM S J, et al. Mice drinking goji berry juice (Lycium barbarum) are protected from UV radiationinduced skin damage via antioxidant pathways[J]. Photochemical and Photobiological Sciences, 2010, 9(4)∶ 60l-607. DOI∶10.1039/b9pp00177h.
[4] YI W G, ZHANG D, HE J G, et al. Matrimony vine inspecting and grading system based on machine vision[J]. Journal of Chinese Agricultural Mechanization, 2015, 36(4)∶ 100-105. DOI∶10.13733/j.jcam.issn.2095-5553.2015.04.026.
[5] ELMASRY G M, NAKAUCHI S. Image analysis operations applied to hyperspectral images for non-invasive sensing of food quality∶ a comprehensive review[J]. Biosystems engineering, 2016, 142∶ 53-82.DOI∶10.1016/j.biosystemseng.2015.11.009.
[6] GOWEN A A, O’DONNELL C P, CULLEN P J, et al. Hyperspectral imaging-an emerging process analytical tool for food quality and safety control[J]. Trends in Food Science and Technology, 2007, 18∶590-598. DOI∶10.1016/j.tifs.2007.06.001.
[7] HE H J, SUN D W. Hyperspectral imaging technology for rapid detection of various microbial contaminants in agricultural and food products[J]. Trends in Food Science and Technology, 2015, 46(1)∶ 99-109. DOI∶10.1016/j.tifs.2015.08.001.
[8] LI J B, RAO X Q, YING Y B. Advance on application of hyperspectral imaging to nondestructive detection of agricultural products external quality[J]. Spectroscopy and Spectral Analysis, 2011, 31(8)∶ 2021-2026. DOI∶10.3964/j.issn.1000-0593(2011)08-2021-06.
[9] LUO Y, HE J G, HE X G, et al. Applied research of agricultural product non-destructive detection using hyperspectral imaging technology[J]. Journal of Agricultural Mechanization Research, 2013,6∶ 1-7. DOI∶10.3969/j.issn.1003-188X.2013.06.001.
[10] MAHESH S, JAYAS D S, PALIWAL J, et al. Hyperspectral imaging to classify and monitor quality of agricultural materials[J].Journal of Stored Products Research, 2015, 61∶ 17-26. DOI∶10.1016/j.jspr.2015.01.006.
[11] YIN Y, XIAO Y J, YU H C. An image selection method for tobacco leave grading based on image information[J]. Engineering in Agriculture, Environment and Food, 2015, 8∶ 148-154. DOI∶10.1016/j.eaef.2015.01.005.
[12] DENG S G, XU Y F, LI X L, et al. Moisture content prediction in tealeaf with near infrared hyperspectral imaging[J]. Computers and Electronics in Agriculture, 2015, 118∶ 38-46. DOI∶10.1016/j.compag.2015.08.014.
[13] HUANG S P, HONG T S, YUE X J, et al. Multiple regression analysis of citrus leaf nitrogen content using hyperspectral technology[J].Transactions of the Chinese Society of Agricultural Engineering, 2013,44(4)∶ 132-138. DOI∶10.3969/j.issn.1002-6819.2013.05.018.
[14] ZHANG C, GUO C T, LIU F, et al. Hyperspectral imaging analysis for ripeness evaluation of strawberry with support vector machine[J].Journal of Food Engineering, 2016, 179∶ 11-18. DOI∶10.1016/j.jfoodeng.2016.01.002.
[15] ZHU Q B, GUAN J Y, HUANG M, et al. Predicting bruise susceptibility of ‘Golden Delicious’ apples using hyperspectral scattering technique[J]. Postharvest Biology and Technology, 2016,114∶ 86-94. DOI∶10.1016/j.postharvbio.2015.12.007.
[16] KAMRUZZAMAN M, MAKINO Y, OSHITA S. Parsimonious model development for real-time monitoring of moisture in red meat using hyperspectral imaging[J]. Food Chemistry, 2016, 196∶ 1084-1091.DOI∶10.1016/j.foodchem.2015.10.051.
[17] KHULAL U, ZHAO J W, HU W W, et al. Nondestructive quantifying total volatile basic nitrogen (TVB-N) content in chicken using hyperspectral imaging (HSI) technique combined with different data dimension reduction algorithms[J]. Food Chemistry, 2016, 197∶ 1191-1199. DOI∶10.1016/j.foodchem.2015.11.084.
[18] LIM J, KIM G, MO C, et al. Detection of melamine in milk powders using near-infrared hyperspectral imaging combined with regression coefficient of partial least square regression model[J]. Talanta, 2016,151∶ 183-191. DOI∶10.1016/j.talanta.2016.01.035.
[19] ZHANG W, PAN L Q, TU S C, et al. Non-destructive internal quality assessment of eggs using a synthesis of hyperspectral imaging and multivariate analysis[J]. Journal of Food Engineering, 2015, 157∶41-48. DOI∶10.1016/j.jfoodeng.2015.02.013.
[20] JIN H L, LI L L, CHENG J H. Rapid and non-destructive determination of moisture content of peanut kernels using hyperspectral imaging technique[J]. Food Analytical Methods, 2015, 8∶2524-2532. DOI∶10.1007/s12161-015-0147-1.
[21] BONEV B, ESCOLANO F, CAZORLA M. Feature selection,mutual information, and the classification of high-dimensional patterns[J]. Pattern Analysis & Applications, 2008, 11(3/4)∶ 309-319.DOI∶10.1007/s10044-008-0107-0.
[22] SHAHIN M A, SYMONS S J. Detection of Fusarium damaged kernels in Canada Western Red Spring wheat using visible/nearinfrared hyperspectral imaging and principal component analysis[J].Computers and Electronics in Agriculture, 2011, 75(1)∶ 107-112.DOI∶10.1016/j.compag.2010.10.004.
[23] SHI J Y, ZOU X B, ZHAO J W, et al. Measurement of chlorophyll distribution in cucumber leaves based on hyper-spectral imaging technique[J]. Chinese Journal of Analytical Chemistry, 2011, 39(2)∶243-247. DOI∶10.3724/SP.J.1096.2011.00243.
[24] SUN J D, DING Z G, ZHOU L H. Image retrieval based on image entropy and spatial distribution entropy[J]. Journal Infrared Millimeter and Waves, 2005, 24(2)∶ 135-139. DOI∶10.3321/j.issn∶1001-9014.2005.02.013.
[25] MODDEMEIJER R. A statistic to estimate the variance of the histogram-based mutual information estimator based on dependent pairs of observations[J]. Signal Processing, 1999, 75(1)∶ 51-63.DOI∶10.1016/S0165-1684(98)00224-2.
[26] KUIJPER A. Mutual information aspects of scale space images[J].Pattern Recognition, 2004, 37(12)∶ 2361-2373. DOI∶10.1016/j.patcog.2004.04.014.
[27] DE I, SIL J. Entropy based fuzzy classification of images on quality assessment[J]. Journal of King Saud University-Computer and Information Sciences, 2012, 24(2)∶ 165-173. DOI∶10.1016/j.jksuci.2012.05.001.
[28] CHENG W W, SUN D W, PU H B, et al. Integration of spectral and textural data for enhancing hyperspectral prediction of K value in pork meat[J]. LWT-Food Science and Technology, 2016, 72∶ 322-329.DOI∶10.1016/j.lwt.2016.05.003.
[29] GAO H X. Applied multivariate statistical analysis[M]. Beijing∶Beijing University, 2010∶ 192-199.
[30] SHONNON C E. A mathematical theory of communication[J]. Acm Sigmobile Mobile Computing & Communications Review, 1948, 5(3)∶379-423.
[31] LIU Z, KARAM L J. Mutual information-based analysis of JPEG2000 contexts[J]. IEEE Trans Image Process, 2005, 14(4)∶ 411-422.DOI∶10.1109/TIP.2004.841199.
[32] GHOLIPOUR A, KEHTARNAVAZ N, YOUSEFI S, et al. Symmetric deformable image registration via optimization of information theoretic measures[J]. Image and Vision Computing, 2010, 28(6)∶965-975. DOI∶10.1016/j.imavis.2009.11.012.
基于信息熵的枸杞分级高光谱图像特征波长选择方法
于慧春,王润博,殷 勇*,刘云宏
(河南科技大学食品与生物工程学院,河南 洛阳 471023)
摘 要:为获得适合枸杞分级的最佳高光谱特征波长图像,实验提出一种基于信息熵的高光谱图像特征波长选择方法。通过计算在不同波长条件下每一个枸杞样本的自信息,得到每一类枸杞高光谱图像的平均自信息;通过计算对应任意2 个不同类别的枸杞样本的互信息,得到任意2 类枸杞高光谱图像的平均互信息。最终获得枸杞高光谱图像在某一波长条件下的平均互信息与各自平均自信息和的比值,定义为A。A值可以作为枸杞分级高光谱图像特征波长选择的量化指标。结果显示,枸杞分级的最优波长为950 nm。最后,提取特定波长条件下所有枸杞图像的纹理特征,并采用Fisher判别分析对6 类枸杞进行分类验证。基于信息熵的枸杞分级高光谱图像特征波长选择方法是可行的。
关键词:高光谱图像;信息熵;特征波长;枸杞;分级
中图分类号:O433
文献标志码:A
文章编号:1002-6630(2017)20-0292-08
References:nces:
引文格式:
收稿日期:2017-01-20
基金项目:河南省科技攻关项目(172102210256;172102310617)
作者简介:于慧春(1977—),女,副教授,博士,主要从事农产品、食品品质无损检测技术研究。E-mail:yukin_le@ 126.com
YU Huichun, WANG Runbo, YIN Yong, et al. Wavelength selection of hyperspectral image analysis for wolfberry grading based on information entropy[J]. 食品科学, 2017, 38(20): 292-299.
DOI:10.7506/spkx1002-6630-201720043. http://www.spkx.net.cn YU Huichun, WANG Runbo, YIN Yong, et al. Wavelength selection of hyperspectral image analysis for wolfberry grading based on information entropy[J]. Food Science, 2017, 38(20)∶ 292-299. DOI∶10.7506/spkx1002-6630-201720043.http∶//www.spkx.net.cn
*通信作者:殷勇(1966—),男,教授,博士,主要从事农产品、食品品质无损检测技术研究。E-mail:yinyong@mail.haust.edu.cn
DOI∶10.7506/spkx1002-6630-201720043