LI Juan1, LIU Rui1,2, WU Tao1, GUO Yu1, ZHANG Min1,2,*
(1. Key Laboratory of Food Nutrition and Safety, Ministry of Education, Tianjin University of Science and Technology, Tianjin 300457, China;2. Tianjin Food Safety and Low Carbon Manufacturing Collaborative Innovation Center, Tianjin 300457, China)
Abstract:This study aimed to evaluate the anti-obesity effects of green tea polysaccharides (GTP), black tea polysaccharides(BTP) and oolong tea polysaccharides (OTP) in 3T3-L1 preadipocytes. The monosaccharide compositions of GTP, BTP and OTP were analyzed using gas chromatography, and the 3-(4,5-dimethyl-2-thiazolyl)-2,5-diphenyl-2-H-tetrazolium bromide (MTT) assay was used to determine the effects of three tea polysaccharides (TPs) on the proliferation of 3T3-L1 preadipocytes. The cell cycle was determined by flow cytometry. The preadipocytes were differentiated into adipocytes using the traditional “cocktail” method and the differentiation rate was measured based on absorbance. The triglyceride (TG)content was measured to analyze lipid accumulation in adipocytes using the phosphoric acid oxidase peroxidase (GPO-PAP)method. The expression of transcription factors related to adipocyte differentiation was analyzed by real-time polymerase chain reaction (RT-PCR). The inhibition of the proliferation and differentiation of 3T3-L1 preadipocytes by three TPs were significantly different (P 〈 0.05). With the addition of 100 μg/mL TPs, the differentiation rates were (62.00 ± 6.61)% (GTP),(82.95 ± 4.25)% (BTP) and (97.24 ± 5.80)% (OTP). In addition, GTP, BTP and OTP could regulate the cell cycle, and the proportions of G0/G1 phase cells after 5 days were (68.52 ± 2.28)%, (67.11 ± 1.68)% and (59.69 ± 1.35)%, respectively.Further investigation of the total RNA extracted from the differentiated preadipocytes revealed that the addition of TPs(100 μg/mL) could regulate the expression of related cytokines. In this study, the inhibitory effect of GTP was more significant than those of BTP and OTP. Up-regulation of of adiponectin (ADP) expression activated the adenosine monophosphate-activated protein kinase (AMPK) signaling pathway, which regulates the expression of related adipocyte factors, and ultimately leading to inhibition of TG synthesis and 3T3-L1 preadipocyte differentiation.
Key words:tea polysaccharides (TPs); anti-obesity activity; 3T3-L1 preadipocytes; differentiation; gene expression
Obesity is a risk factor for arteriosclerosis, diabetes,and hyperlipidemia and is a major public health problem in many countries[1-3]. Adipose tissue plays an important role in lipid metabolism, including triglyceride (TG) storage and fatty acid release[4-6]. Adipogenesis involves un-differentiated preadipocytes converting to differentiated adipocytes and plays a key role in fat mass growth. Controlling adipogenesis is a potential strategy for obesity prevention[7], and 3T3-L1 preadipocytes have been widely used as an in vitro model for analyzing adipocyte differentiation[8]. The occurrence of obesity was found to be related to the disorder of adipocytes factors and the related regulatory transcription factors[9-11].
Recently, studies have provided evidence that tea polysaccharides (TPs) are one of the main bioactive components of tea with anti-obesity activity[12]. However, the effect of the three types of TPs has rarely been compared. In this study, we explored the anti-obesity effects of green tea polysaccharides (GTP), black tea polysaccharides (BTP) and oolong tea polysaccharides (OTP) on precursor and mature adipocytes; the cell cycle; the TG content and expression of adipogenic transcription factors, such as peroxisome proliferator-activated receptor gamma (PPARγ) and sterol regulatory element-binding protein-1c (SREBP-1c)[13].However, as important regulatory factors, the relationship between PPARγ and SREBP-1c and acetyl-CoA carboxylase(ACC), lipoprotein lipase (LPL), stearoyl-CoA desaturase enzyme 1 (SCD1) and adiponectin (ADP) remains obscure.
In this study, the anti-obesity effects of these factors on lipid metabolism and the relationship between these factors were evaluated. In addition, the results of this study can provide a reference for further exploration, development and utilization of highly efficient functional foods with health benefits for obese people.
1.1 Materials and reagents
3T3-L1 preadipocytes were obtained from the Chinese Basic Medical Center (resource number:3111C0001CCC000155). GTP, BTP, OTP were prepared by the Laboratory of Food Additives and Functional Ingredients at Tianjin University of Science and Technology[14].
Dulbecco’s modified Eagles medium (DMEM),0.25 g/100 mL (in phosphate buffered saline (PBS)) trypsin,oil red O staining kits, 3-(4,5-dimethyl-2-thiazolyl)-2,5-diphenyl-2-H-tetrazolium bromide (MTT), calf serum(CS), fetal bovine serum (FBS) Gibco Co. (USA);isobutyl methyl xanthine (IBMX), dexamethasone, bovine insulin Sigma-Aldrich Co. (USA); TG enzyme assay kit Pulilai (Beijing, China); RNA extraction kit, One-Step SYBR®PrimeScript™ Plus real-time polymerase chain reaction(RT-PCR) kit Takara Biotechnology (Da Lian) Co. Ltd.(Japan). All other chemicals were of analytical grade.
1.2 Instruments and equipments
Gas chromatograph Agilent Co. (USA); calibur flow cytometer Becton Dickinson (USA); inverted phase contrast microscope Olympus Co. (Japan); microplate reader Thermo Co. (USA); real-time polymerase chain reaction (RT-PCR) instrument Bio-Rad (USA); CO2incubator Shellab Co. (USA).
1.3 Methods
1.3.1 Determination of the main components of TPs
The neutral sugar, acidic polysaccharide, protein and polyphenol contents in the three types of GTP, BTP and OTP were determined by the phenol-sulfuric acid method[15],sulfuric acid-carbazole method[16], Coomassie brilliant blue method[17]and Folin-phenol method[18], respectively.
1.3.2 Determination of the sugar composition of TPs by gas chromatography
Samples of 10 mg of GTP, BTP and OTP were hydrolyzed using trifluoroacetic acid. Eight monosaccharide standards (rhamnose, arabinose, ribose, xylose, mannose,D-galacturonic acid, galactose and glucose), and an internal standard (inositol) and the hydrolysates of the TP samples were derivatized before analysis by gas chromatography. The percentages of the sugars were calculated according to the peak area. The formula for calculation is as formula (1):
Where, Piis the percentage content of component i/%;Siis the peak area of the measured group; Ssis the peak area of the internal standard; fiis the weight correction factor of the measured component; fsis a weight correction factor for an internal standard; Mmis the mass of the sample being tested/g; Msis the internal standard mass/g.
1.3.3 3T3-L1 preadipocytes culture
The preadipocytes were cultured in DMEM containing a high glucose concentration (4 500 mg/L) supplemented with 10% CS (V/V), penicillin (100 U/mL) and streptomycin(100 U/mL) in an atmosphere of 5% CO2at 37 ℃.
1.3.4 Preadipocytes viability assay
The MTT assay was used to assess cell toxicity and viability[19]. 3T3-L1 preadipocytes were treated with GTP, BTP and OTP at 50, 100, 200 and 400 μg/mL, and treatment with 0 μg/mL served as the control group (NC). After 1, 3 and 5 days,a 5 mg/mL MTT solution (30 μL) was added, and the cells were incubated at 37 ℃ for 4 h. Thereafter, the supernatant was completely removed, and dimethyl sulphoxide was used to dissolve the formazan crystals. The optical density (OD)value was read at 570 nm using a microplate reader. The cell viability rate was calculated according to the formula (2).
1.3.5 Cell cycle measurement
3T3-L1 preadipocytes were treated with 100 μg/mL GTP, BTP, OTP and NC (0 μg/mL). After 3 and 5 days, the tested cells were harvested by trypsin digestion and adjusted to a density of 4 × 10⁵cells/mL. The cells were washed with cold PBS and re-suspended in 1 mL of ethanol. The treated cells were fixed with 70% ethanol and incubated overnight at 4 ℃. The fixed cells were centrifuged and resuspended in 1 mL of a propidium iodide solution (containing 500 U/mL RNase) for 30 min at room temperature. The sample was stored in the dark at 4 ℃, and the cell cycle was analyzed using a calibur flow cytometer .
1.3.6 3T3-L1 preadipocytes differentiation
3T3-L1 preadipocytes were differentiated into adipocytes using the traditional “cocktail” method[20-21]. After cells had reached confluence, they were incubated for 2 days, and the culture medium was then changed to a differentiation-induction medium containing 10 μg/mL insulin, 1 μmol/L dexamethasone, and 5 mmol/L IBMX in DMEM with 10%FBS (V/V), which was then treated with GTP, BTP and OTP (50, 100, 200 and 400 μg/mL) every 2 days. After 2 days (Day 4), the differentiation-induction medium without dexamethasone and IBMX was replaced. After two more days (Day 6), the cells were cultured in growth medium without insulin. After 8 days of culturing, 90% of the preadipocytes had differentiated into adipocytes. The cells in these conditions were harvested for further studies.
1.3.7 Oil red O staining
Lipid accumulation in the induced 3T3-L1 preadipocytes was determined using the oil red O staining method[22]. The cells were washed twice with PBS and then fixed with 10%formalin in PBS (pH 7.4) (V/V) for 1 h. The cells were stained with oil red O solution in isopropanol for 2 h and then washed 3 times with PBS. The fat droplets in the adipocytes were stained red by oil red O dye, the oil red O dye was eluted with isopropanol, and the OD was measuring at 520 nm.The differentiation rate was calculated according to the formula (3).
1.3.8 Determination of TG in adipocytes
Different concentration of GTP, BTP and OTP (50,100, 200 and 400 μg/mL) were added on day 0 of 3T3-L1 preadipocytes differentiation in the culture medium, and the culture solution was discarded on day 8, followed by washing twice with PBS. The TG levels in the adipocytes were quantified using a TG enzyme assay kit.
1.3.9 RNA extraction and RT-PCR
Gene primers were designed using Premier Primer 5 software. The following primers were used: forward 5’-CTGTCCCTGTATGCCTCTG-3’ and reverse 5’-TGATGTCACGCACGATTT-3’ for β-actin (reference gene); forward 5’-GACCACTCGCATTCCTTT-3’and reverse 5’-CCACAGACTCGGCACTCA-3’ for PPARγ; forward 5’-CTTCTGGAGACATCGCAAAC-3’and reverse 5’-GGTAGACAACAGCCGCATC-3’ for SREBP-1c; forward 5’-ACTGCCACTTCAACCACA-3’and reverse 5’-ATCAGCGTCATCAGGAGA-3’ for LPL; forward 5’-CTCCTGCTTTGGTCCCTC-3’ and reverse 5’-GCCAGTGCTGCCGTCATA-3’ for ADP;forward 5’-TGACCTGAAAGCCGAGAA-3’ and reverse 5’-CGTTGAGCACCAGAGTGTAT-3’ for ACC; and forward 5’-TGACCTGAAAGCCGAGAA-3’ and reverse 5’-CGTTGAGCACCAGAGTGTAT-3’ for SCD1. An RNA extraction kit was used to extract the total RNA from the NC and experimental groups (100 μg/mL TPs). The RNA was used in RT-PCR experiments using a One-Step SYBR®PrimeScript™ Plus RT-PCR kit. The amplification conditions were 42 ℃ for 5 min and 95 ℃ for 10 s, followed by 40 cycles of 95 ℃ for 5 s, 55 ℃ for 30 s, and 72 ℃ for 30 s.The results were normalized using β-actin as a reference gene. The amount of expression was calculated using the 2-ΔΔCtmethod.
1.4 Statistical analysis
Data are expressed as the . Group results were compared by analysis of variance (ANOVA), followed by Duncan’s test using SPSS software. P 〈 0.05 was considered as significant difference; P 〈 0.01 was considered as extremely significant difference.
2.1 Main components of TPs
TPs are biologically active compounds in tea and are a type of acidic polysaccharide or acidic glycoprotein. As shown in Table 1, GTP, BTP and OTP contained a small amount of protein. The contents of neutral sugars were not significantly different (P 〉 0.05), but the uronic acid content of GTP was significantly higher than that of BTP and OTP (P 〈 0.05).
Table 1 Major compositions of GTP, BTP and OTP%
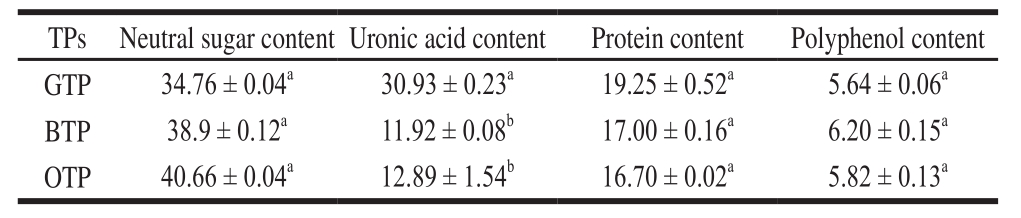
Note: Different letter indicate significant difference in the same line (P 〈 0.05).
2.2 Monosaccharide compositions of TPs
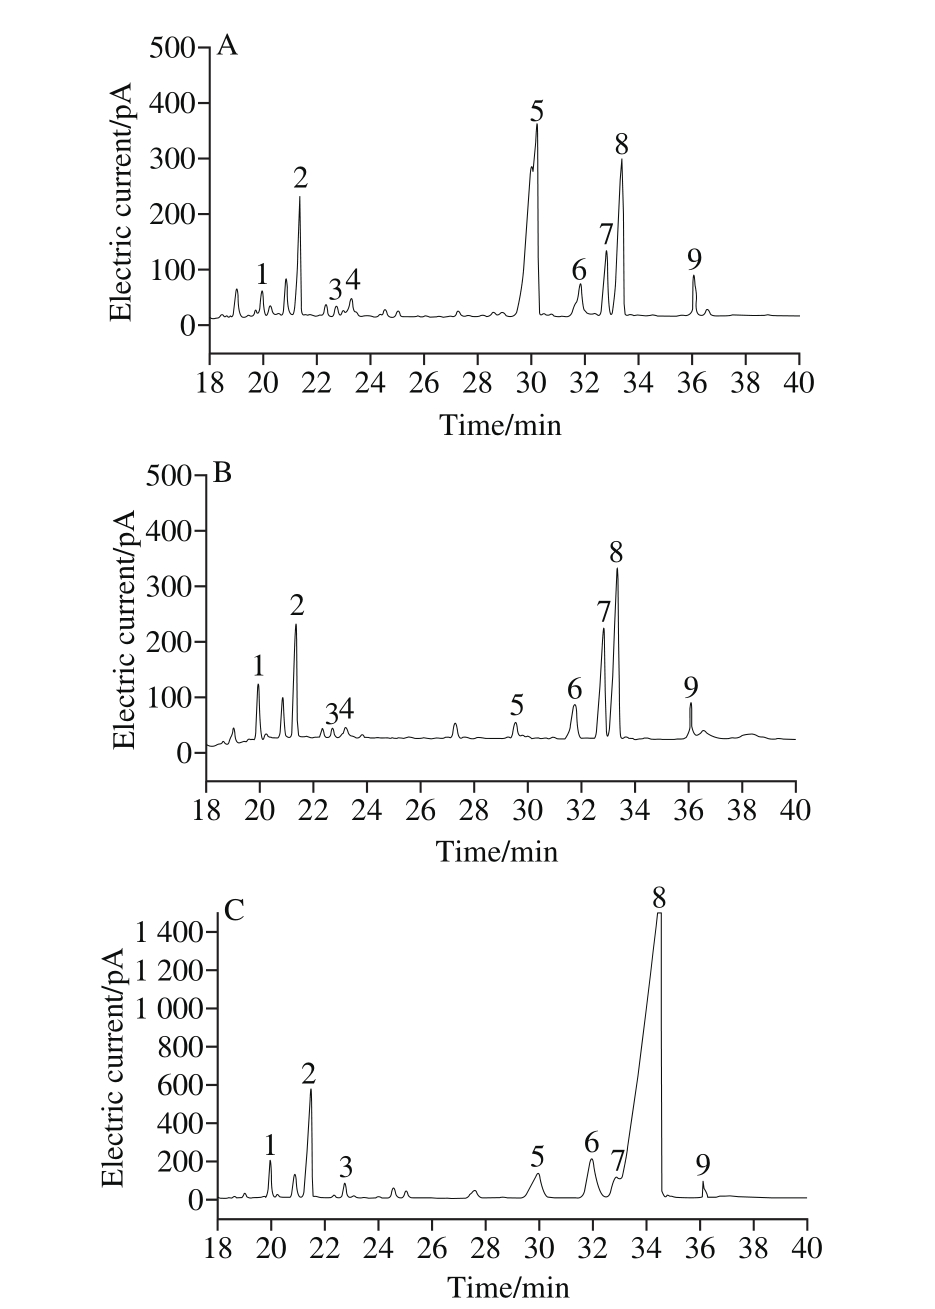
Fig. 1 Gas chromatograms of GTP (A), BTP (B) and OTP (C)
A. GTP; B. BTP; C. OTP. 1-9. rhamnose, arabinose, xylose, ribose,D-galacturonic acid, mannose, galactose, glucose and inositol.
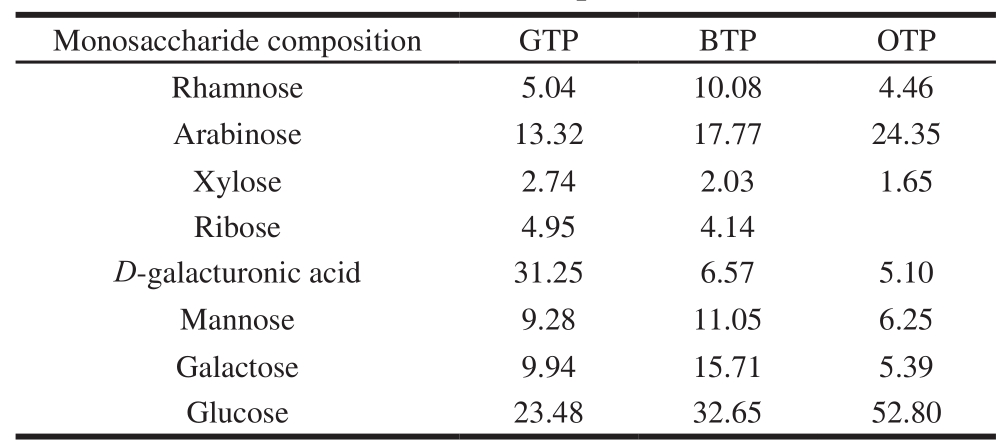
The monosaccharide compositions of GTP, BTP and OTP were determined by gas chromatography (Fig. 1).BTP and OTP were mainly composed of arabinose, mannose and glucose. The molar percentage of glucose was the highest in BTP and OTP at 32.65% and 52.80%, respectively. The main components of GTP were arabinose, glucose and D-galacturonic acid, and the molar percentage of D-galacturonic acid was the highest in GTP at 31.25% (Table 2).
Table 2 Monosaccharide compositions of three TPs
2.3 Effect of TPs on 3T3-L1 preadipocytes proliferation
The MTT assay results demonstrated that the inhibitory effect of the TPs on 3T3-L1 preadipocytes increased with increasing treatment time and concentration. As shown in Fig. 2,after treatment of the 3T3-L1 preadipocytes with GTP, BTP and OTP, the inhibition effect of GTP was extremely significantly higher than those of BTP and OTP (P 〈 0.01). There was no significant difference between the effects of BTP with OTP on the first day (P 〉 0.05). However, as time prolonging, the samples treated with 200 μg/mL showed extremely significant difference among the three types of TPs on the third day(P 〈 0.01). Considering that the cell viability was greater than 50%, when the TPs concentration was 100 μg/mL on the fifth day, the cell viability of the GTP group was (50.71 ± 3.69)%,whereas those of the other two groups were (60.39 ± 7.50)%(BTP) and (88.5 ± 4.81)% (OTP).
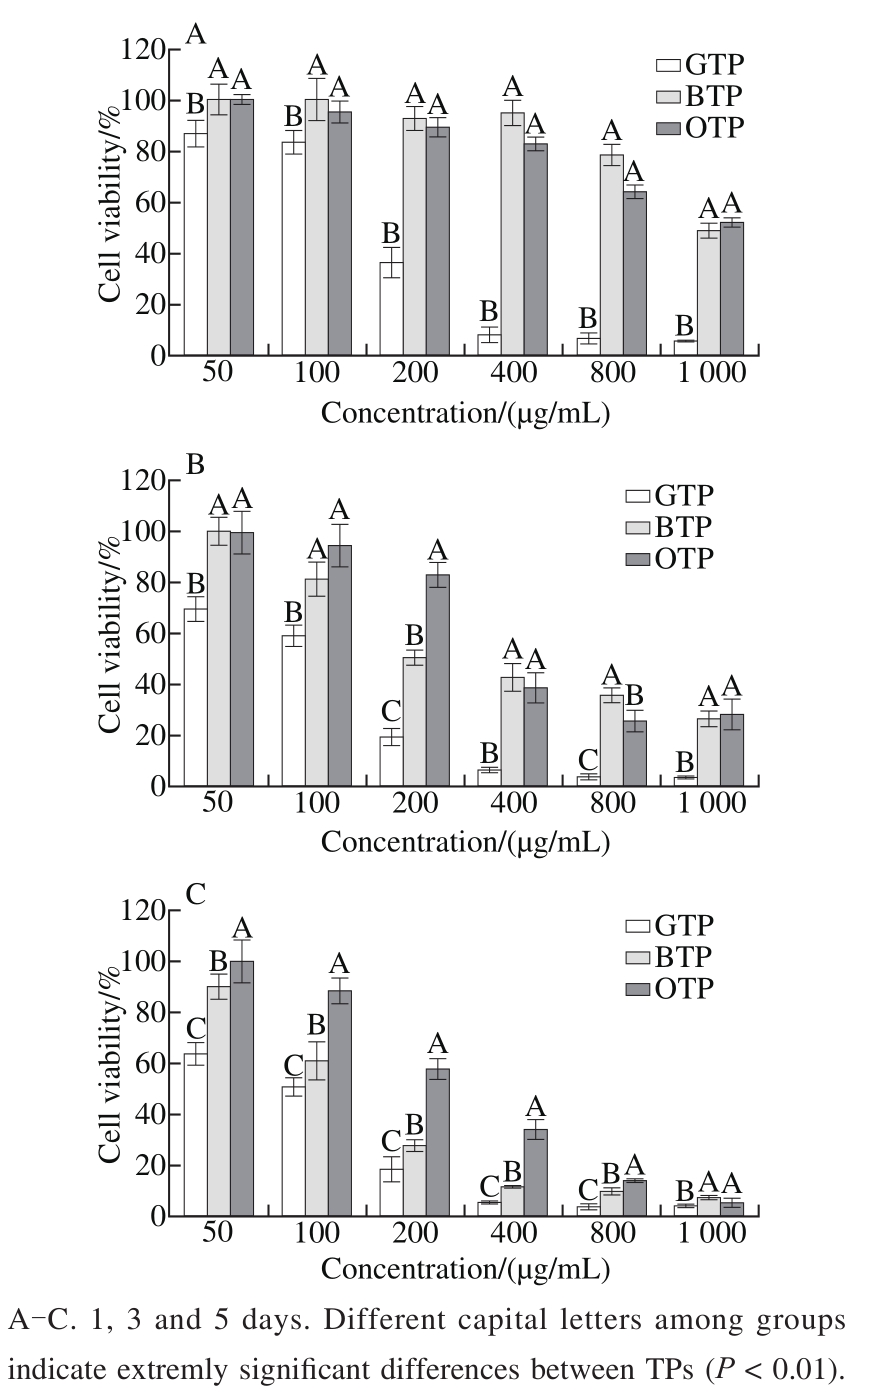
Fig. 2 Effects of TPs on the cell viability of 3T3-L1 preadipocytes
2.4 Cell cycle detection
G0/G1, S, G2 and M are different phases of the cell cycle. Differentiation of 3T3-L1 preadipocytes into mature adipocytes is initiated by mitotic clonal expansion (MCE),a prerequisite for differentiation, in which G0/G1-growtharrested preadipocytes are induced to differentiate[23].Researchers believe that when the cell growth is delayed in the G0/G1 phase and prevented from entering the next phase for a long period of time, the cells will never enter the next phase and finish DNA replication. With long-term retention,the G1 phase will activate certain intracellular mechanisms and initiate the cell program death signal, ultimately inducing cell apoptosis[24-25]. To investigate whether the effect of TPs on the 3T3-L1 preadipocytes proliferation and pre-differentiation stages was associated with the cell cycle,3T3-L1 preadipocytes were treated with the TPs for 3 and 5 days in the early stage of adipogenesis, and the cell quantities were analyzed. As shown in Table 3, the cell cycle was arrested in the G0/G1 phase in a time-dependent manner after TPs treatment.Compared with the NC, the TPs delayed the cell cycle from the S phase to the G2/M phase at 5 days, with increasing cell quantity of G0/G1 phase cells (P 〈 0.05). Notably, compared with the other groups, the proportion of G0/G1 phase cells induced by GTP was the highest on the fifth day.
Table 3 Effects of TPs on the cell cycle of 3T3-L1 preadipocytes at 3 and 5 days

Note: *. indicate significant difference compared with NC (P 〈 0.05).
2.5 TPs inhibit the differentiation of 3T3-L1 preadipocytes
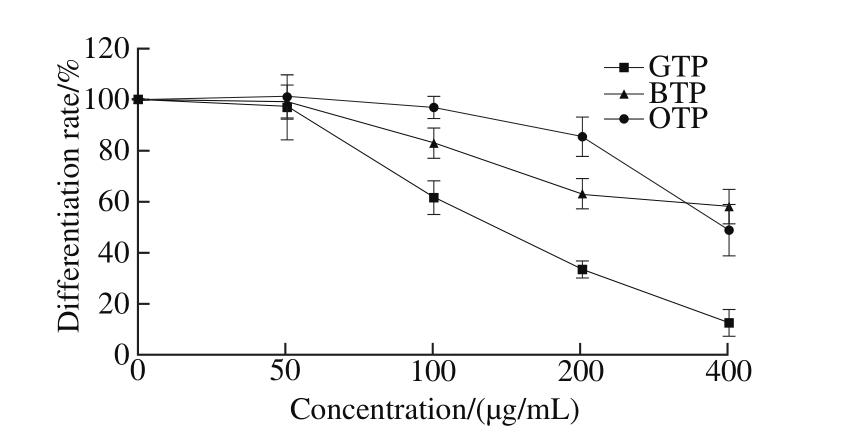
Fig. 3 Effects of TPs on the differentiation of 3T3-L1 preadipocytes
During the differentiation of 3T3-L1 preadipocytes,we added different concentrations of TPs (50, 100, 200 and 400 μg/mL). In addition, the differentiation rate of 3T3-L1 preadipocytes significantly decreased with increasing TPs concentration (P 〈 0.05), indicating a potential anti-obesity effect in 3T3-L1 preadipocytes. Fig. 3 showed significant differences in the effects of the three types of TPs on cell differentiation. The inhibition of preadipocytes differentiation by GTP was the strongest at the same concentration of TPs. At 100 μg/mL GTP, lipid accumulation was inhibited to approximately (62.00 ± 6.61)% of that in the NC cells. However,the cell differentiation rates of the BTP and OTP groups were(82.90 ± 4.25)% and (97.24 ± 5.80)%, respectively, at the same concentration.
2.6 Effect of TPs on the TG content
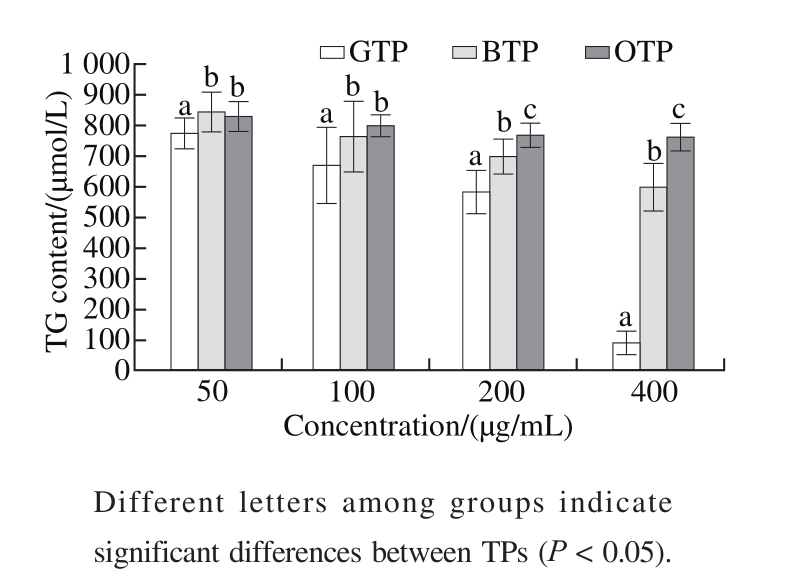
Fig. 4 Effects of TPs on the TG content
At the stage of adipocyte differentiation, a high level of TG accumulated in the adipocytes. The addition of TPs significantly decreased the amount of oil droplets and TG levels in the cells, indicating that the TPs are potent inhibitors of adipogenesis. As shown in Fig. 4, with the increase in the TPs concentration, the inhibitory effect of GTP on the TG content was significantly stronger than those of BTP and OTP(P < 0.05). In addition, at the same concentration, GTP also showed a stronger inhibitory effect, which was especially evident at 400 μg/mL TPs, where the TG content was(91.28 ± 14.47) μmol/L in the GTP group, but (596.50 ±81.95) and (762.07 ± 43.84) μmol/L in BTP and OTP group.This further proved that GTP had effectively inhibited the differentiation of 3T3-L1 preadipocytes.
2.7 Effect of TPs on the expression of adipogenic genes
The RT-PCR results showed that the mRNA expression of LPL, SREBP-1c, PPARγ and ACC in the TPs groups were down-regulated compared to that in NC. In addition,the mRNA expression of ADP was up-regulated by the TPs(P < 0.05) (Fig. 5A).
Adipose tissue plays an important role in whole-body energy production[26], connects the endocrine and metabolic pathways and regulates the balance of energy[27]. An imbalance between energy intake and energy consumption will affect the development of adipose tissue. The three types of TPs inhibited the proliferation and differentiation of 3T3-L1 preadipocytes. Adipocyte differentiation is accompanied by a variety of transcription factors and the expression of specific genes for adipocyte factors[28]. SREBP-1c and PPARγ mainly regulate the expression of lipid biosynthesisrelated genes and promote the synthesis of fatty acids[29].PPARγ is the most adipose tissue-specific transcription factor in the PPAR family and plays an important role in the regulation of preadipocytes differentiation; its expression is closely related to obesity, typeⅡ diabetes, high lipid hyperinsulinemia and insulin resistance[30-31]. The SREBP-1c gene encodes the key nuclear transcription factor SREBP-1c,which has been shown to regulate de novo lipogenesis and TG-rich lipoprotein metabolism experimentally. SREBP-1c overexpression induces insulin resistance, diabetes,nonalcohol fatty liver disease, and accelerates atherosclerosis in mice[32]. At the same time, some studies have indicated that the target gene is activated by up-regulation of the expression of PPARγ, resulting in the accumulation of fat[33]. These two genes (SREBP-1c and PPARγ) can activate adipocyte factor LPL[34]. ACC is a key enzyme in TG synthesis, preadipocyte differentiation and adipogenesis and plays a very important role in the regulation of fatty acid synthesis[35]. Studies have shown that the promotion of SREBP-1c expression could up-regulate ACC expression and then promote the synthesis of fatty acids and TGs[36]. SCD1 is highly expressed in liver and adipose tissue. In studies on SCD1 as a target for obesity intervention, SCD1 inhibition during 3T3-L1 adipocyte differentiation decreased de novo fatty acid synthesis[37].The SCD1 global knock-out mouse has a lean phenotype,is resistant to diet-induced obesity, and exhibits increased β oxidation[33]. Some researchers believe that the expression of SCD1 is also subject to the regulation of SREBP-1c[38].
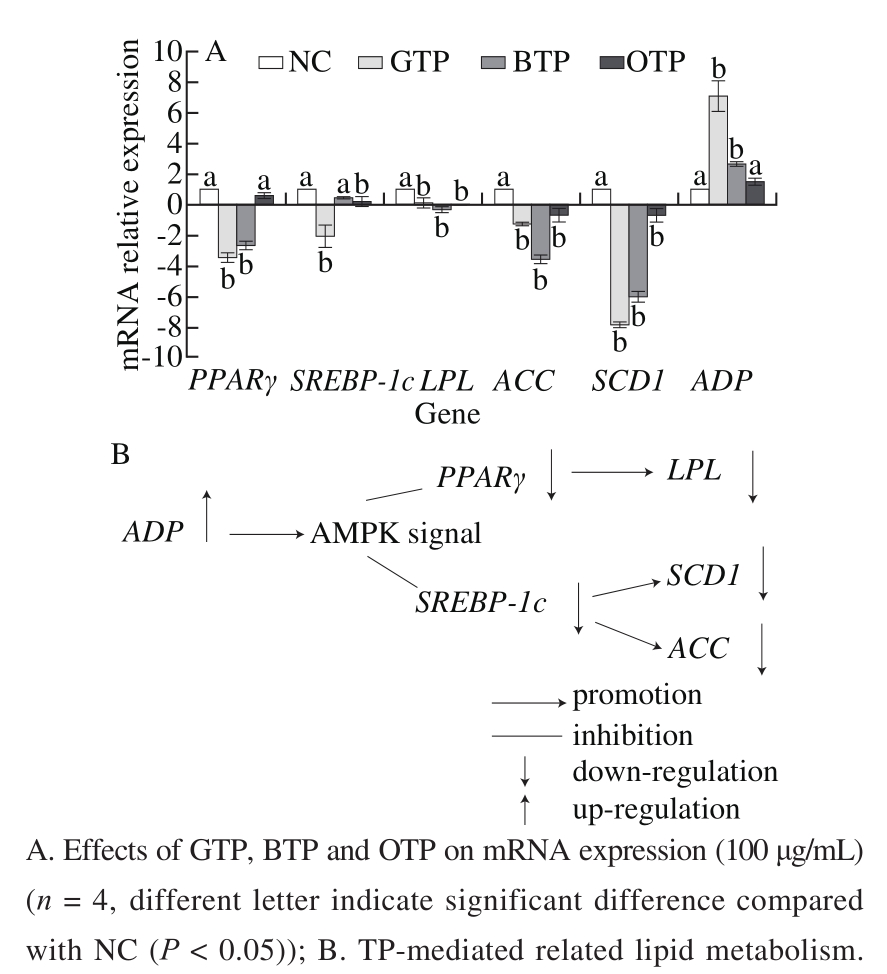
Fig. 5 Effects of TPs on the mRNA expression of adipogenic genes
As shown in Fig. 5, TG synthesis in 3T3-L1 adipocytes was inhibited by down-regulating the expression of SCD1 after the addition of the TPs. ACC and SCD1 are key enzymes in the biosynthesis of fatty acids and unsaturated fatty acids, and down-regulation of their expression directly inhibited lipid synthesis. Therefore, TPs can down-regulate PPARγ and SREPB-1c such that the downstream genes (ACC and SCD1) synthesis are inhibited, thereby inhibiting TG synthesis and exerting a favorable effect on lipid metabolism disorders. ADP is involved in the metabolism of glucose and lipids, increasing the oxidation of fatty acids, enhancing the insulin resistance of the liver, and promoting insulin sensitivity[39]. In addition, some studies have suggested that ADP can activate the adenosine monophosphate-activated protein kinase (AMPK) signaling pathway by activating two receptors, ADP1 (adipor1) and ADP 2 (adipor2)[40]. Impaired ADP can lead to insulin resistance and obesity[41]. Fig. 5A showed that adding the TPs resulted in up-regulation of ADP expression compared to NC and ADP being upstream of the AMPK protein. This up-regulation inhibited the expression of AMPK such that a series of lipid metabolism-related genes were inhibited[42]. Thus, the TPs mediated the AMPK signaling pathway by up-regulating the expression of ADP,which can inhibit the expression of PPARγ and SREBP-1c[43],subsequently leading to the down-regulation of LPL and ACC expression and ultimately inhibiting the differentiation of 3T3-L1 preadipocytes and TG accumulation (Fig. 5B).
In summary, the inhibition effects on the proliferation and differentiation of 3T3-L1 preadipocytes by the three types of TPs were significantly different. The GTP group was significantly different in its regulation of the expression of all adipocyte factors (P < 0.05), indicating that the inhibitory effect of GTP was more significant than those of BTP and OTP. As shown in Table 1, the content of uronic acids in GTP was obviously higher than that in BTP and OTP, which was further confirmed by the monosaccharide composition (Fig. 1),revealing that GTP contained more D-galacturonic acids.Uronic acid, as an acidic polysaccharide, exhibited greater weight loss and lipid-lowering activity in a previous study[44],indicating that uronic acid plays a significant role in inhibiting the proliferation and differentiation of preadipocytes.
The glucose content in BTP was the highest, followed by OTP. However, the main component of GTP was galactose.The TPs, especially GTP, significantly inhibited the growth and differentiation of 3T3-L1 preadipocytes (P < 0.05). TPs increased the number of 3T3-L1 preadipocytes in the G0/G1 phase and had a significantly positive effect on cell apoptosis.Through RT-PCR, we found that the three types of TPs down-regulated the expression of PPARγ, SREBP-1c, LPL,ACC and SCD1 and up-regulated the expression of ADP.Changes in the mRNA expression of these genes will affect the inhibition of 3T3-L1 preadipocytes differentiation, the accumulation of TGs and the regulation of lipid metabolism.
[1] BODEN G. Free fatty acids, a major link between obesity, insulin resistance, inflammation, and atherosclerotic vascular disease[M]//FONSECA V A. Cardiovascular endocrinology. Clifton: Humana Press Inc., 2008: 61-70. DOI:10.1007/978-1-59745-141-3_4.
[2] ITO M, ITO J, KITAZAWA H, et al. (-)-Ternatin inhibits adipogenesis and lipid metabolism in 3T3-L1 cells[J]. Peptides, 2009, 30(6):1074-1081. DOI:10.1016/j.peptides.2009.02.008.
[3] WHIGHAM L D, ISRAEL B A, ATKINSON R L. Adipogenic potential of multiple human adenoviruses in vivo and in vitro in animals[J]. American Journal of Physiology-Regulatory, Integrative and Comparative Physiology, 2006, 290(1): 190-194. DOI:10.1152/ajpregu.00479.2005.
[4] CHEN H X, WANG Z S, QU Z S, et al. Physicochemical characterization and antioxidant activity of a polysaccharide isolated from oolong tea[J]. European Food Research and Technology, 2009,229(4): 629-635. DOI:10.1007/s00217-009-1088-y.
[5] LUO L. New research progress on the extraction methods and physiological activity of tea polysaccharides[J]. Journal of Anhui Agricultural Sciences, 2012(27): 13592-13594. DOI:10.3969/j.issn.0517-6611.2012.27.131.
[6] WANG Y F, YANG Z W, WEI X L. Antioxidant activities potential of tea polysaccharide fractions obtained by ultra filtration[J].International Journal of Biological Macromolecules, 2012, 50(3): 558-564. DOI:10.1016/j.ijbiomac.2011.12.028.
[7] GWON S Y, AHN J Y, JUNG C H, et al. Shikonin suppresses ERK 1/2 phosphorylation during the early stages of adipocyte differentiation in 3T3-L1 cells[J]. BMC Complementary and Alternative Medicine 2013, 13(1): 1-8. DOI:10.1186/1472-6882-13-207.
[8] TAKAHASHI K, SATOH K, KATAGAWA M, et al. Scallop shell extract inhibits 3T3-L1 preadipocyte differentiation[J]. Fisheries Science, 2012, 78(4): 897-903. DOI:10.1007/s12562-012-0515-3.
[9] JIAO P, CHEN Q, SHAH S, et al. Obesity-related upregulation of monocyte chemotactic factors in adipocytes: involvement of nuclear factor-kappaB and c-Jun NH2-terminal kinase pathways[J]. Diabetes,2009, 58(1): 104-115. DOI:10.2337/db07-1344.
[10] HYOJUNG K, AKO H, KEITA T, et al. (-)Epigallocatechin gallate suppresses the differentiation of 3T3-L1 preadipocytes through transcription factors FoxO1 and SREBP1c[J]. Cytotechnology, 2010,62(3): 245-255. DOI:10.1007/s10616-010-9285-x.
[11] KOWALSKA K, OLEJNIK A, RYCHLIK J, et al. Cranberries(Oxycoccus quadripetalus) inhibit adipogenesis and lipogenesis in 3T3-L1 cells[J]. Food Chemistry, 2014, 148: 246-252. DOI:10.1016/j.foodchem.2013.10.032.
[12] XU Y, ZHANG M, WU T, et al. The anti-obesity effect of green tea polysaccharides, polyphenols and caffeine in rats fed with a high-fat diet[J]. Food & Function, 2015, 6(1): 297-304. DOI:10.1039/c4fo00970c.
[13] DE SÁPAULA M, RICHARD A J, HANGH, et al. Transcriptional regulation of adipogenesis[J]. Comprehensive Physiology, 2017, 7(2):635-674. DOI:10.1002/cphy.c160022.
[14] XU X, LUO X F, CHEN Z X, et al. Experimental studies on the extract technology of tea polysaccharide from green tea by orthogonal test[J]. Zhong Yao Cai, 2005, 28(4): 327. DOI:10.3403/01529720.
[15] XU J, JIANG R P, XIA G H, et al. Determination of polysaccharide in Pleurotus ostreatus by phenol sulfuric acid method[J]. Journal of Anhui Agricultural Sciences,2011, 39(5): 2649-2651. DOI:10.3969/j.issn.0517-6611.2011.05.050.
[16] WANG W P, GUO Q Y, LI L, et al. Determination of uronic acid content in polysaccharides of Chaenomeles speciosa[J].Food Technology, 2007, 32(10): 84-86. DOI:10.3969/j.issn.1005-9989.2007.10.024.
[17] DUAN W W, ZHANG X F, AO C J. Study on the methods of removing protein of Allium mongolicum polysaccharide[J]. Feed Industry, 2011,32(13): 26-28. DOI:10.3969/j.issn.1001-991X.2011.13.008.
[18] YOU J M, CAO X Z. Analysis on the distribution of tea polyphenol in tea tree by Folin-Ciocalteaut method[J]. Hubei Agricultural Sciences,2013, 52(10): 2417-2419. DOI:10.3969/j.issn.0439-8114.2013.10.051.
[19] CHOI E J, JUNG J Y, KIM G H. Genistein inhibits the proliferation and differentiation of MCF-7 and 3T3-L1 cells via the regulation of ERα expression and induction of apoptosis[J]. Experimental and Therapeutic Medicine, 2014, 8(2): 454-458. DOI:10.3892/etm.2014.1771.
[20] ZHANG X H, HUANG B, CHOI S K, et al. Anti-obesity effect of resveratrol-amplified grape skin extracts on 3T3-L1 adipocytes differentiation[J]. Nutrition Research and Practice, 2012, 6(4): 286-293. DOI:10.4162/nrp.2012.6.4.286.
[21] RAO Y, LIU H, GAO L, et al. Discovery of natural alkaloid bouchardatine as a novel inhibitor of adipogenesis/lipogenesis in 3T3-L1 adipocytes[J]. Bioorganic & Medicinal Chemistry, 2015, 23(15): 4719-4727. DOI:10.1016/j.bmc.2015.05.057.
[22] LEE B J, NAM S Y, JEONG J H, et al. Effects of diglycerideconjugated linoleic acid on proliferation and differentiation of 3T3-L1 cells[J]. Toxicological Research, 2007, 23(3): 223-229. DOI:10.5487/tr.2007.23.3.223.
[23] KADENBACH B, ARNOLD S, LEE I, et al. The possible role of cytochrome c oxidase in stress-induced apoptosis and degenerative diseases[J]. Biochimica et Biophysica Acta, 2004, 1655: 400-408.DOI:10.1016/j.bbabio.2003.06.005.
[24] JEDINAK A, SLIVA D. Pleurotus ostreatus inhibits proliferation of human breast and colon cancer cells through p53-dependent as well as p53-independent pathway[J]. International Journal of Oncology, 2009,33(6): 1307-1313. DOI:10.3892/ijo_00000122.
[25] ILAVENIL S, ARASU M V, LEE J C, et al. Positive regulations of adipogenesis by Italian ryegrass (Lolium multiflorum) in 3T3-L1 cells[J]. BMC Biotechnology, 2014, 14: 1-11. DOI:10.1186/1472-6750-14-54.
[26] AHIMA R S, LAZAR M A. Adipokines and the peripheral and neural control of energy balance[J]. Molecular Endocrinology, 2008, 22(5):1023-1031. DOI:10.1210/me.2007-0529.
[27] BAZER F W, WU G Y, JOHNSON G A, et al. Environmental factors affecting pregnancy: endocrine disrupters, nutrients and metabolic pathways[J]. Molecular & Cellular Endocrinology, 2014, 398(1/2):53-68. DOI:10.1016/j.mce.2014.09.007 .
[28] STOCKER C, O’DOWD J, MORTON N M, et al. Modulation of susceptibility to weight gain and insulin resistance in low birthweight rats by treatment of their mothers with leptin during pregnancy and lactation[J]. International Journal of Obesity and Related Metabolic Disorders: Journal of the International Association for the Study of Obesity, 2004, 28(1): 129-136. DOI:10.1038/sj.ijo.0802476.
[29] CHAVEY C, BOUCHER J, MONTHOUËL-KARTMANN M N, et al.Regulation of secreted protein acidic and rich in cysteine during adipose conversion and adipose tissue hyperplasia[J]. Obesity, 2006,14(11): 1890-1897. DOI:10.1038/oby.2006.220.
[30] TYAGI S, GUPTA P, SAINI A S, et al. The peroxisome proliferatoractivated receptor: a family of nuclear receptors role in various diseases[J]. Journal of Advanced Pharmaceutical Technology &Research, 2011, 2(4): 236-240. DOI:10.4103/2231-4040.90879.
[31] GIOVANNI M, SIMONA B, MAURIZIO C, et al. Impact of sterol regulatory element-binding factor-1c polymorphism on incidence of nonalcoholic fatty liver disease and on the severity of liver disease and of glucose and lipid dysmetabolism[J]. American Journal of Clinical Nutrition, 2013, 98(4): 895-906.
[32] LI S J, BROWN M S, GOLDSTEIN J L. Bifurcation of insulin signaling pathway in rat liver: mTORC1 required for stimulation of lipogenesis, but not inhibition of gluconeogenesis[J]. Proceedings of the National Academy of Sciences, 2010, 107(8): 3441-3446.DOI:10.1073/pnas.0914798107.
[33] BENKALFAT N B, MERZOUK H, BOUANANE S, et al. Altered adipose tissue metabolism in offspring of dietary obese rat dams[J].Clinical Science, 2011, 121(1): 19-28. DOI:10.1042/cs20100534.
[34] YIM M J, HOSOKAWA M, MIZUSHINA Y, et al. Suppressive effects of amarouciaxanthin a on 3T3-L1 adipocyte differentiation through down-regulation of PPARγ and C/EBPα mRNA expression[J].Journal of Agricultural and Food Chemistry, 2011, 59(5): 1646-1652.DOI:10.1021/jf103290f.
[35] ICHIKAWASHINDO Y, SAKURAI T, KAMIYOSHI A, et al. The GPCR modulator protein RAMP2 is essential for angiogenesis and vascular integrity[J]. Journal of Clinical Investigation, 2008, 118(1):29-39. DOI:10.1172/jci33022.
[36] REPA J J, LIANG G S, OU J F, et al. Regulation of mouse sterol regulatory element-binding protein-1c gene (SREBP-1c) by oxysterol receptors, LXRα and LXRβ[J]. Genes & Development, 2000, 14(22):2819-2830. DOI:10.1101/gad.844900.
[37] COLLINS J M, NEVILLE M J, HOPPA M B, et al. De novo lipogenesis and stearoyl-CoA desaturase are coordinately regulated in the human adipocyte and protect against palmitate-induced cell injury[J]. Journal of Biological Chemistry, 2010, 285(9): 6044-6052.DOI:10.1074/jbc.m109.053280.
[38] XU Y J, YANG Q H, HAN L, et al. Effects of soothing liver and invigorating spleen recipes on SREBP-1c, SCD-1 mRNA and proteins expression in hepatocytes of NAFLD rats[J]. Journal of Chinese Medicinal Materials, 2014, 37(1): 80-86. DOI:10.4268/cjcmm20142024.
[39] BERG A H, COMBS T P, SCHERER P E. ACRP30/adiponectin:an adipokine regulating glucose and lipid metabolism[J]. Trends in Endocrinology & Metabolism, 2002, 13(2): 84-89. DOI:10.1016/s1043-2760(01)00524-0.
[40] YAMAUCHI T, NIO Y, MAKI T, et al. Targeted disruption of AdipoR1 and AdipoR2 causes abrogation of adiponectin binding and metabolic actions[J]. Nature Medicine, 2007, 13(3): 332-339.DOI:10.1038/nm1557.
[41] PAJVANI U B, HAWKINS M, COMBS T P, et al. Complex distribution, not absolute amount of adiponectin, correlates with thiazolidinedione-mediated improvement in insulin sensitivity[J].Journal of Biological Chemistry, 2004, 279(13): 12152-12162.DOI:10.1074/jbc.m311113200.
[42] VU V, BUI P, EGUCHI M, et al. Globular adiponectin induces LKB1/AMPK-dependent glucose uptake via actin cytoskeleton remodeling[J]. Journal of Molecular Endocrinology, 2013, 51(1):155-165. DOI:10.1530/jme-13-0059.
[43] LEE Y K, LEE W S, HWANG J T, et al. Curcumin exerts antidifferentiation effect through AMPKalpha-PPAR-gamma in 3T3-L1 adipocytes and antiproliferatory effect through AMPKalpha-COX-2 in cancer cells[J]. Journal of Agricultural and Food Chemistry, 2009,57(1): 305-310. DOI:10.1021/jf802737z.
[44] WANG Y F. Study on the separation and purification, structure and structure activity relationship of tea polysaccharides[D]. Wuxi:Jiangnan University, 2005: 19-24.
不同茶多糖对3T3-L1前脂肪细胞分化的抑制作用比较
李 娟1,刘 锐1,2,吴 涛1,郭 郁1,张 民1,2,*
(1.天津科技大学 食品营养与安全教育部重点实验室,天津 300457;2.天津食品安全低碳制造协同创新中心,天津 300457)
摘 要:本实验利用小鼠3T3-L1前脂肪细胞对绿茶多糖(green tea polysaccharides,GTP)、红茶多糖(black tea polysaccharides,BTP)和乌龙茶多糖(oolong tea polysaccharides,OTP)的减肥作用进行评价。使用气相色谱对GTP、BTP、OTP的单糖组成进行分析。采用噻唑蓝染色法测定3 种茶多糖(tea polysaccharides,TPs)对3T3-L1前脂肪细胞增殖活力的影响。使用流式细胞仪检测3 种TPs对3T3-L1前脂肪细胞细胞周期的影响。采用传统“鸡尾酒”法诱导3T3-L1细胞分化成脂后,测吸光度并计算其分化率。采用甘油磷酸氧化酶-过氧化物酶(glycerol phosphate oxidase-peroxidase,GPO-PAP)法测定细胞中甘油三酯(triglyceride,TG)含量的变化。采用实时荧光定量聚合酶链式反应(real-time polymerase chain reaction,RT-PCR)技术测定与脂质代谢相关基因的表达量。结果显示3 种TPs均能显著抑制3T3-L1前脂肪细胞的增殖与分化(P<0.05)。添加100 μg/mL的TPs能使细胞分化率显著下降至(62.00±6.61)%(GTP)、(82.95±4.25)%(BTP)、(97.24±5.80)%(OTP)。另外,在细胞培养至第5天检测表明,这3 种TPs显著促进G0/G1期细胞数量的累积,细胞比例分别为(68.52±2.28)%(GTP)、(67.11±1.68)%(BTP)、(59.69±1.35)%(OTP)。RT-PCR分析结果显示TPs可以调控相关脂肪细胞因子的表达。在本研究中,在3T3-L1前脂肪细胞中GTP的减肥作用强于BTP和OTP。TPs的加入上调脂联素的表达从而激活腺苷酸活化蛋白激酶信号通路调控相关脂肪细胞因子的表达,并最终抑制TG的合成与3T3-L1前脂肪细胞的分化。
收稿日期:2016-07-19
基金项目:“十二五”国家科技支撑计划项目(2012BAD33B08);天津市应用基础与前沿技术研究计划重点项目(14JCZDJC34800);天津市应用基础与前沿技术研究计划(青年基金项目)(15JCQNJC14900)
作者简介:李娟(1990—),女,硕士研究生,研究方向为植物多糖活性及分子营养学。E-mail:1097130466@qq.com
关键词:茶多糖;减肥作用;3T3-L1前脂肪细胞;分化;基因表达
中图分类号:TS201.4
文献标志码:A
文章编号:1002-6630(2017)21-0187-08
引文格式:LI Juan, LIU Rui, WU Tao, et al. Comparative study of the anti-obesity effects of green, black and oolong tea polysaccharides in 3T3-L1 preadipocytes[J]. 食品科学, 2017, 38(21): 187-194.
DOI:10.7506/spkx1002-6630-201721030.http://www.spkx.net.cn
References:
*通信作者:张民(1972—),男,教授,博士,研究方向为食品科学。E-mail:zm0102@tust.edu.cn
DOI:10.7506/spkx1002-6630-201721030
LI Juan, LIU Rui, WU Tao, et al. Comparative study of the anti-obesity effects of green, black and oolong tea polysaccharides in 3T3-L1 preadipocytes[J]. Food Science, 2017, 38(21): 187-194. (in English with Chinese abstract)DOI:10.7506/spkx1002-6630-201721030. http://www.spkx.net.cn