Application of Biosynthesis Pathway Analysis and Metabolic Flux Analysis for Optimization of Fermentation of α-Amylase Inhibitor
ZHANG Hongzhi
1, XU Qingyang
1, CAO Huajie
1, BAI Fang
2, CHEN Ning
1, BAI Gang
2,*
(1. China National and Local United Engineering Lab of Metabolic Control Fermentation Technology, College of Biotechnology, Tianjin University of Science and Technology, Tianjin 300457, China; 2. College of Pharmacy, Nankai University, Tianjin 300071, China)
Abstract:This study aimed to improve the yield of α-amylase inhibitor and the eff i ciency of carbohydrate utilization during the fermentation of Streptomyces coelicoflavus (S. coelicoflavus). The metabolic network leading to the biosynthesis of α-amylase inhibitor was analyzed to fi nd out the key nodes which inf l uenced the production of α-amylase inhibitor. The effects of sodium glutamate on the metabolic fl ux distributions during the middle and late periods of fermentation were studied, and metabolic flux analysis for α-amylase inhibitor production at pseudo-steady state was also conducted. The results showed that the metabolic fl ux channeled to the α-amylase inhibitor biosynthesis pathway was 1.84 in batchwise fermentation without the addition of sodium glutamate, while, with the addition of sodium glutamate (the concentration was maintain at 4.0 g/L), the metabolic fl ux was 3.18, suggesting that the addition of sodium glutamate could change the metabolic fl ux distributions of the key nodes (glucose-6-phosphate, sedoheptulose-7-phosphate, and glutamate) and enhance the biosynthesis of α-amylase inhibitor.
Key words:α-amylase inhibitor; metabolic fl ux analysis; sodium glutamate
The α-amylase inhibitor has been used in the therapy of type Ⅱ diabetes in many countries, in order to enable patients to better control blood sugar contents while living with starchcontaining diets. The α-amylase inhibitor is one of the latest successful products of bacterial secondary metabolism to be introduced into the pharmaceutical market in the world
[1-5]. The structure of α-amylase inhibitor is complex, and chemical synthetic steps are relatively cumbersome and costly. To date, α-amylase inhibitor is produced almost through microbial fermentation
[6]. However, as a typical second metabolism, fermentation process of α-amylase inhibitor usually leads to low level of production of α-amylase inhibitor. How to improve the fermentation yield of α-amylase inhibitor is an important task at present.
In the recent years, the metabolic engineering method has successfully changed the metabolic flux distribution in the cell, which makes the product to be more accumulated. Pathway analysis and metabolic flux analysis method is the theoretical basis to guide the genetic manipulation in metabolic engineering and is a basic method of metabolic network analysis
[7-8]. With these methods, the biggest advantage is that there is no need to know the dynamic characteristics of various enzymes in the metabolic pathway and a lot of important information about the microbial metabolism
[7]. In this paper, by applying pathway analysis, we determined the established α-amylase inhibitor biosynthesis metabolic flux distribution, and optimized the α-amylase inhibitor synthesis pathway, its metabolic fl ux distribution and the maximum theoretical yield. In order to provide a theoretical basis for the optimal fermentation conditions for producing α-amylase inhibitor, the metabolic fl ux distributions of α-amylase inhibitor in the middle and later fermentation periods were studied, and the metabolic fl ux before and after adding sodium glutamate was also studied as well.
1 Materials and Methods
1.1 Materials
1.1.1 Microorganisms
S. coelicof l avus strain ZG0656 collected from the soil at the Nankai University campus in 2005 was identif i ed by the Department of Microbiology, Nankai University. A voucher specimen (CGMCC 2097) was deposited in China General Microbiological Culture Collection Center, Institute of Microbiology, Chinese Academy of Sciences.
1.1.2 Medium
The seed medium contained the components as follows: 10 g/L glucose, 10 g/L starch soluble, 5 g/L yeast extract, 1.5 g/L K
2HPO
4, 0.5 g/L MgSO
4, 0.001 g/L FeSO
4and 0.25 g/L (NH
4)
2SO
4.
The fermentation medium for producing α-amylase inhibitor contained the components as follows: 20 g/L glucose, 60 of maltose, 40 g/L corn steep liquor, 3 g/L K
2HPO
4, 0.5 g/L NaCl, 0.6 g/L MgSO
4·7H
2O, and 0.01 g/L FeSO
4·7H
2O.
The pH of both seed and fermentation media was adjusted to 7.0 with 4 mol/L NaOH solution.
1.2 Instruments and equipments
5 L Jar fermentor was purchased from Biotech-2002 Bioprocess controller (Baoxing, Shanghai, China). High performance liquid chromatography (HPLC) (1200 series) was obtained from Agilent Technologies, (Lexington, MA, USA).
1.3 Methods
1.3.1 Process of fermentation
A single colony of S. coelicoflavus strain ZG0656 was inoculated in to a 1 L baff l ed fl ask containing 0.1 L of seed medium and cultivated at 28 ℃ with shaking at 150 r/min for 48 h.
Fed-batch glutamate fermentation was performed in 5 L jar fermentor containing 3 L of production medium with 15% inoculum size. During the process of α-amylase inhibitor fermentation, pH was maintained at 7.0 with 25% ammonia. The temperature of growth phase was maintained at 28 ℃. The dissolved oxygen (DO) level of growth phase and production phase were maintained at approximately 40% and 30% saturation by adjusting the agitation and aeration rate, respectively.
1.3.2 Analytical methods
Biomass was represented by dry cell weight (DCW), which was measured as follows. Aliquots of culture broth (10 mL) were centrifuged at 13 000 r/min for 20 min. The pellets were washed twice with distilled water and dried to constant weight at 80 ℃.
Organic acids were quantif i ed by HPLC equipped with a Zorbax SB-Aq column (4.6 mm×250 mm), and 20 mmol/L KH
2PO
4(pH 2.2) was used as a mobile phase with a fl ux rate at 1.0 mL/min. UV absorption was performed at 210 nm, and the column temperature was maintained at 35 ℃.
Amino acids were analyzed as 2,4-dinitrof l uorobenzene derivatives by using HPLC
[9]. The α-amylase inhibitor was measured according to known methodologies
[10].
2 Results and Analysis
2.1 Pathway analysis of α-amylase inhibitor
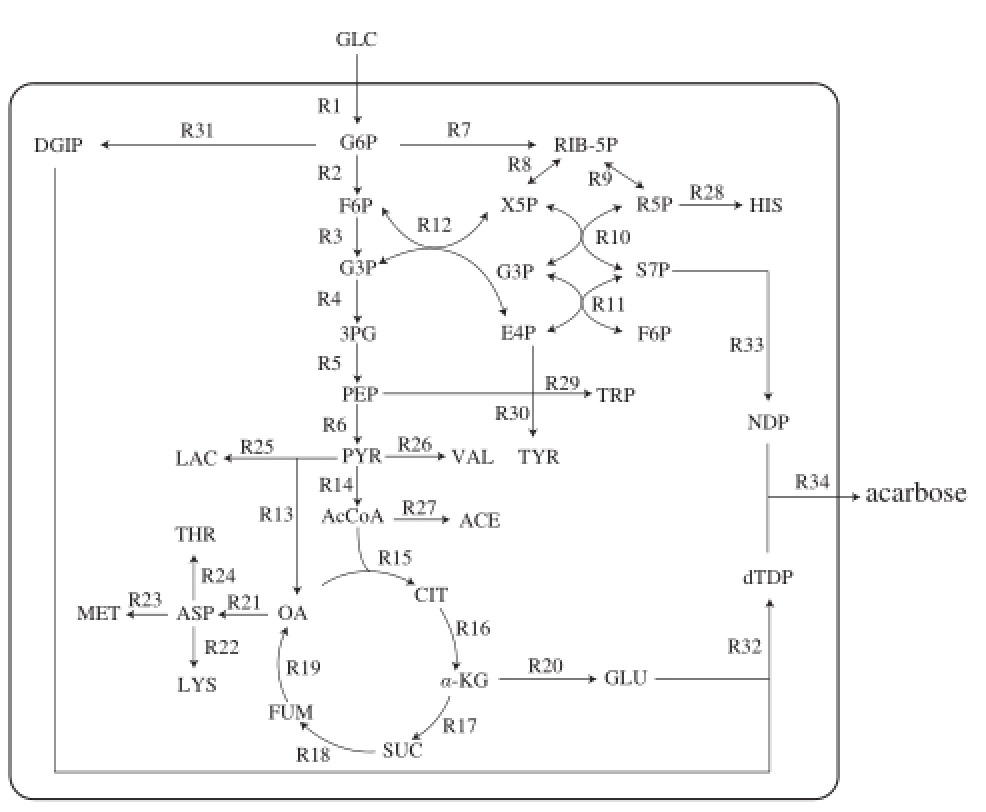
GLC. total sugar; G6P. glucose-6-phosphate; F6P. fructose-6-phosphate; G3P. glyceradehyde-3-phosphate; 3PG. 3-phosphoglycerate; PEP. phosphoenolpyruvate; PYR. pyruvate; AcCoA. acetyl coenzyme A; CIT. citric acid; α-KG. α-ketoglutarate; SUC. succinic acid; FUM. fumaric acid; OA. oxaloacetate; RIB-5P. ribulose-5-phosphate; X5P. xylulose-5-phosphate; R5P. ribose-5-phosphate; S7P. sedoheptulose-7-phosphate; E4P. erythrose-4-phosphate; LAC. lactic acid; VAL. valine; ACE. acetic acid; GLU. glutamate; ASP. aspartate; THR: threonine; MET. methionine; LYS. lysine; TRP. tryptophan; TYR. tyrosine; HIS. histidine; DG1P. D-glucose-1-phosphate; NDP. NDP-1-epi-valiolone-7-P; dTDP. dTDP-4-amino-4,6-dideoxy-D-glucose. The same below.
Fig.1 Metabolic network
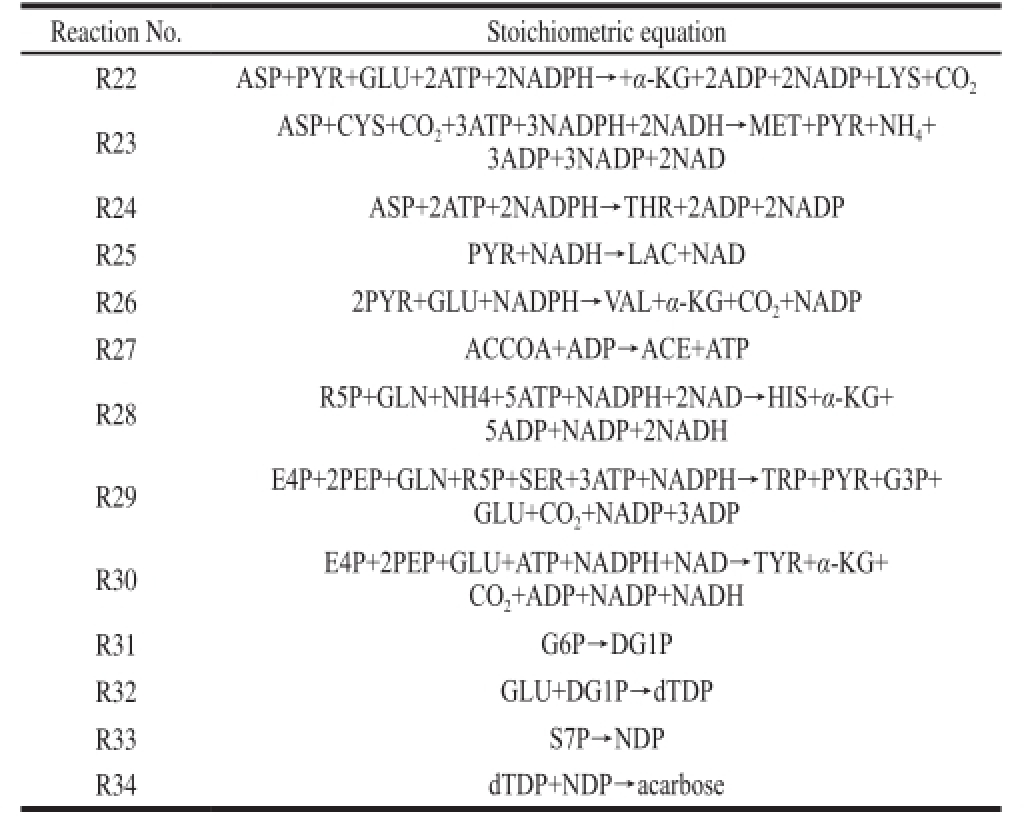
Table1 Metabolic reactions

?
Continue Table 1
?
The model for the biosynthetic pathway (Fig. 1) of α-amylase inhibitor from S. coelicoflavus ZG0656 was constructed based on the literature
[11-25]. A total of 34 biochemical reactions describing both catabolism and anabolism of the cell were considered in this study (Table 1). 2.1.1 The establishment of metabolic fl ux balance model of α-amylase inhibitor
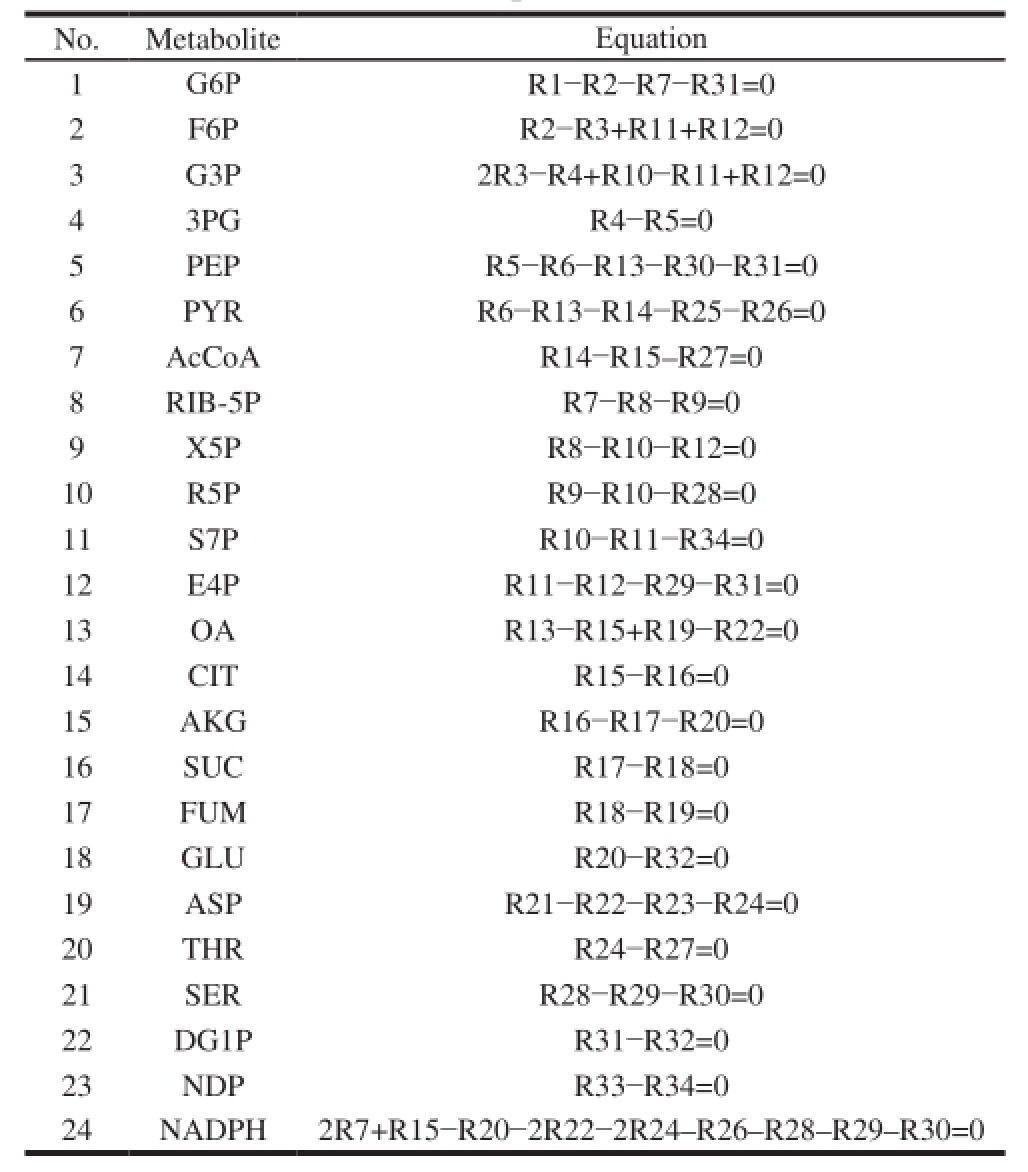
Table2 Reaction rate equations of metabolic nodes
?
In this work, the metabolic flux balance model was established mainly based on the assumptions or principles as follows: the biomass synthesis was not considered becausethe research was carried out in the steady growth period; the isozyme could not be distinguished and they must be treated as the same reaction; no glyoxylate cycle existed for the metabolic process of S. coelicoflavus ZG0656; no transhydrogenase existed for the inter-conversion between NADPH and NADH; the consumption energy and the maintenance energy were not equivalent because of too much futile energy in the non-growth period. Therefore, the ATP equivalent was not considered in the paper; according to the fi xed ratio of the reaction, no branching points of intermediate reaction can be simplified into one reaction equation. Reaction rate equations of metabolic nodes of the α-amylase inhibitor biosynthesis are shown in Table 2.
The number of equations is 24, unknown number is 34, degree of freedom is 10, in order to determine the metabolic fl ux distribution in the network, 10 rate equations were measured. According to 1.3.3, α-amylase inhibitor was produced by fed-batch fermentation using a 5 L jar fermentor. Total sugar, acetic acid, lactic acid, six amino acids (aspartic acid, glutamic acid, tryptophan, histidine, tyrosine and valine) and α-amylase inhibitor were selected as the known parameters, taking these parameters into the metabolic rate balance equation, using the linear programming method to calculate the metabolic flux distribution. In addition, the distribution of the ideal metabolic fl ow can be also calculated by the linear programming method.
2.1.2 The metabolic flow distribution of α-amylase inhibitor
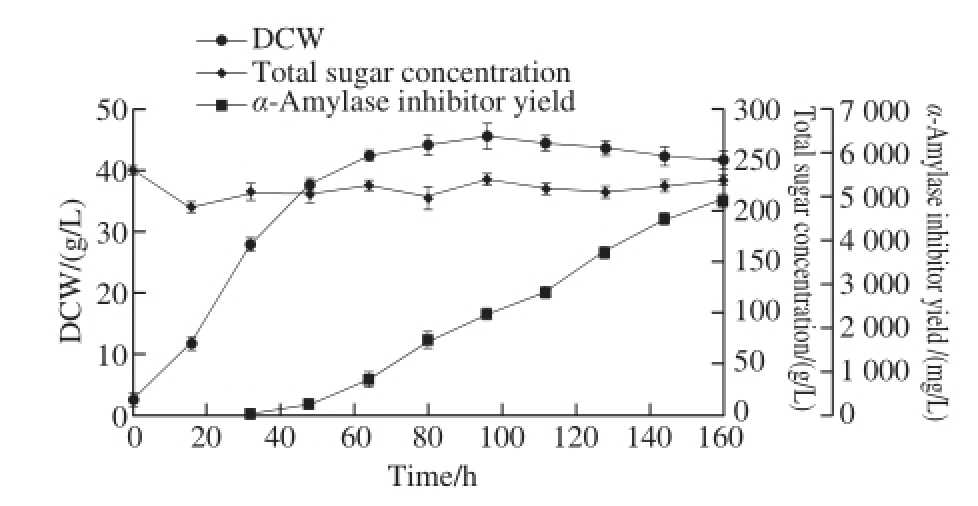
Fig.2 Time courses of fermentation parameters of S. coelicof l avus ZG0656
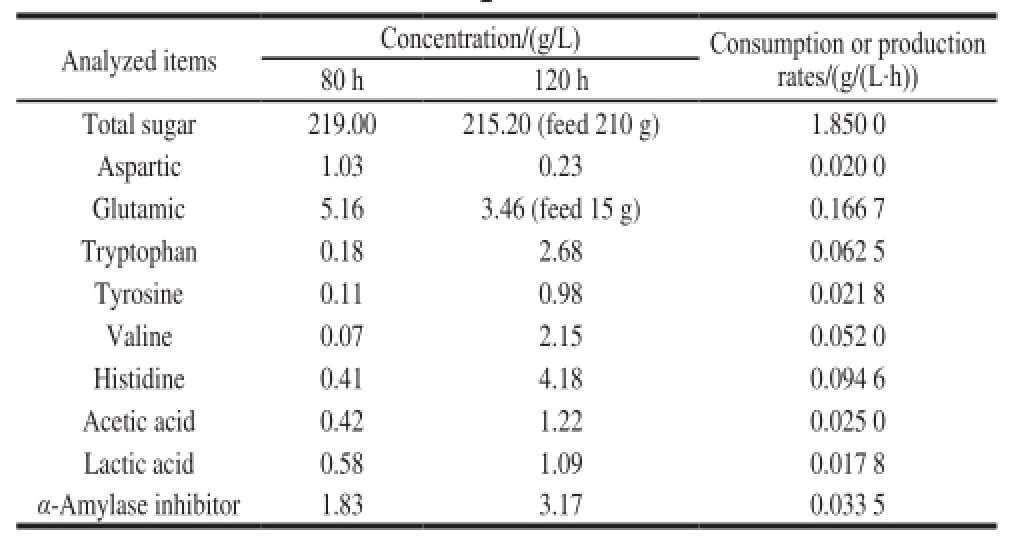
The α-amylase inhibitor was produced via fed-batch fermentation of S. coelicof l avus ZG0656 in 5 L jar fermentor. The fermentation process curve was shown in Fig. 2. No obvious change in biomass was seen after 80 h. The bacterial intracellular metabolism was maintained in a quasi-steady state during the growth period. The total sugar, acetic acid, lactic acid, six amino acids (aspartic acid, glutamic acid, tryptophan, histidine, tyrosine and valine) and the metabolic rate of α-amylase inhibitor during the steady growth period was determined and the results were shown in Table 3. In this paper, the metabolic fl ow analysis during the period of 80-120 h was carried out.
Table3 The concentrations and reaction rates of metabolites during the middle and late periods of fermentation
?
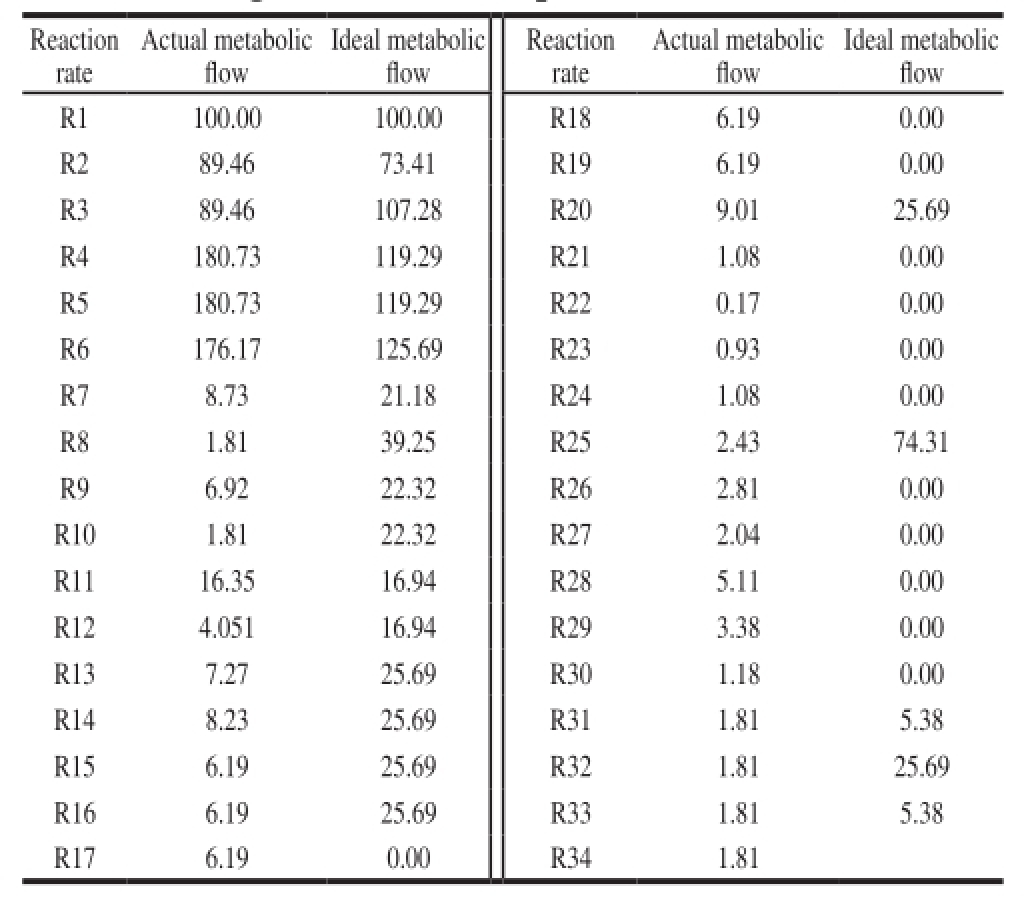
Table4 Metabolic fl ux distribution for α-amylase inhibitor biosynthesis during the middle and late periods of fermentation
?
The metabolic flow distribution of α-amylase inhibitor during mid-late fermentation period was obtained by the LINGO. The results were shown in Table 4.
2.1.3 Analysis of the main metabolic flux nodes of α-amylase inhibitor during mid-late fermentation period
2.1.3.1 Analysis of metabolic fl ux of G6P node
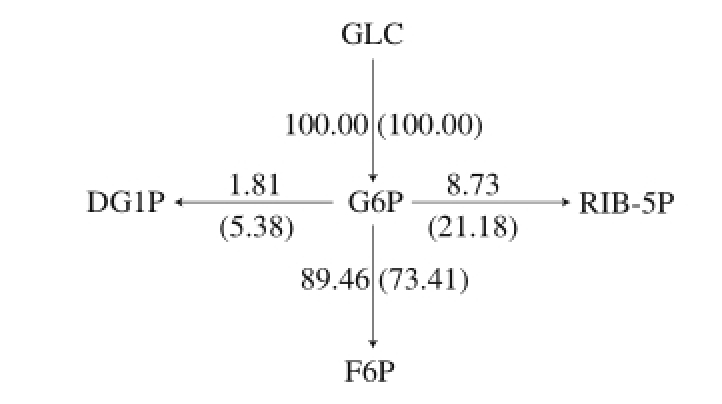
Fig.3 Metabolic fl ux distribution of G6P node
Actual and the ideal metabolic flow distribution (ideal metabolic flow is in brackets) of G6P node was shown in Fig. 3. The major metabolic pathways of carbon source are Embden–Meyerhof–Parnas (EMP), hexose monophosphate shunt (HMP or pentose phosphate pathway) and tricarboxylic acid (TCA), at the same time, G6P is the precursor of α-amylase inhibitor biosynthesis. The actual metabolic fl ow rates of entering the HMP and EMP pathways were 8.73 and 89.46, pathway metabolic flow entering the α-amylase inhibitor synthetic pathway was 1.81, this showed that EMP pathways was relatively active in synthetic pathway of α-amylase inhibitor. The ideal metabolic flow rates entering the HMP and EMP pathway were 21.18 and 73.41 at the α-amylase inhibitor in synthetic pathway, entering the α-amylase inhibitor in synthetic pathway was 5.38. This indicated that most of the carbon source was fl owed into the EMP pathway while the carbon source fl owing into α-amylase inhibitor synthesis pathway was less. In addition, the main role of the HMP pathway is to provide NADPH and precursor substances for α-amylase inhibitor biosynthesis. Therefore, improving HMP pathway metabolic flow can enhance α-amylase inhibitor biosynthesis.
2.1.3.2 Analysis of metabolic fl ux of S7P node

Fig.4 The fl ux distribution of S7P node
Actual and ideal metabolic flow distribution (ideal metabolic fl ow is in brackets) of S7P node is shown in Fig. 4. S7P is a node in the pentose phosphate pathway. The precursor substances of α-amylase inhibitor, 2-epi-5-epivaliolone, can be obtained under the action of cyclase
[26]. The ideal metabolic flow rates entering the S7P and NDP pathways were 22.32 and 5.38. The actual metabolic flow entering the S7P and NDP pathway were 1.81. This showed that most of the carbon fl owed into F6P, only a minority of carbon fl owed into NDP.
2.1.3.3 Analysis of metabolic fl ux of GLU node

Fig.5 Metabolic fl ux distribution of GLU node
Actual and ideal metabolic flow distribution (ideal metabolic flow is in brackets) of S7P node was shown in Fig. 5. The ideal metabolic fl ow entering the GLU and dTDP pathway was also 25.69 while the actual metabolic flows entering the GLU and dTDP pathways were 6.19 and 1.81, respectively. Thus, it can be seen that in the late stage of α-amylase inhibitor fermentation, the actual metabolic flow of GLU node is far less than that of ideal metabolic fl ow. Lee et al.
[27]used isotope labeling method to explore the source of the N atom for the core structure of α-amylase inhibitor. Their experimental results showed that the core structure of N atoms was mostly derived from the α-N of glutamate, meaning that the α-N of glutamate is the direct source of N atoms in the core structure. Thus, glutamic acid can be used as a precursor directly added to the fermentation medium.
2.2 Impacts of sodium glutamate on metabolic flux distributions of α-amylase inhibitor fermentation
2.2.1 Impacts of sodium glutamate concentrations on byproducts
The production of by-products during the fermentation process caused the waste of carbon source and reduced the carbon flow for α-amylase inhibitor synthesis. In order to determine the fermentation medium of monosodium glutamate concentration, the monosodium glutamate concentrations at 0, 2, 4 and 6 g/L were screened, the concentrations of byproducts, including tryptophan, histidine, acetic acid and lactic acid, were determined every 6 h of cultivation in 5 L jar fermentor.
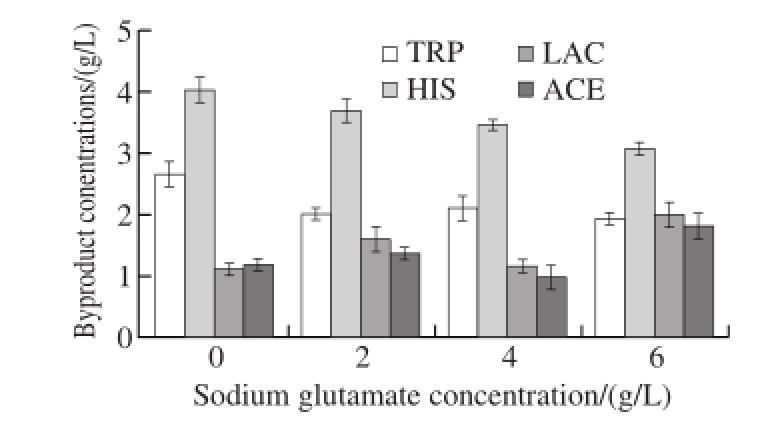
Fig.6 Impact of sodium glutamate concentration on by-products
Fig.6 showed that with the increase of the concentration of sodium glutamate in the fermentation process, the accumulation of by-products of tryptophan, histidine accumulation was reduced while concentrations of acetic acid and lactic acid appeared to be increased. Without adding sodium glutamate, the accumulations of by-products of tryptophan and histidine were 2.67 and 4.03 g/L, respectively. When sodium glutamate was added to maintain concentration in different gradients, the accumulation of ammonia acid was decreased but the difference was not significant. The accumulation of by-products of histidine was graduallydeclined. When the concentration of sodium glutamate was maintained at 2, 4 and 6 g/L, accumulations of tryptophan were 2.02, 2.11 and 1.94 g/L, respectively, while the accumulations of histidine were 3.69, 3.45 and 3.08 g/L, respectively. When the concentrations of sodium glutamate were maintained at 4 g/L, accumulations of both acetic acid and lactic acid were relatively low.
2.2.2 Impacts of sodium glutamate concentrations on α-amylase inhibitor production
Since the N atom of α-amylase inhibitor is mainly derived from the α-N of glutamic acid
[27], therefore, the concentration of glutamic acid in the fermentation can have a great inf l uence on the synthesis of α-amylase inhibitor.
In order to find out the optimal sodium glutamate concentration, the sodium glutamate concentrations were controlled at 0, 2, 4 and 6 g/L during the α-amylase inhibitor fermentation by S. coelicoflavus ZG0656 in the 5 L jar fermentor, respectively. The DCW and the yield of α-amylase inhibitor in each case were shown in Fig. 7.
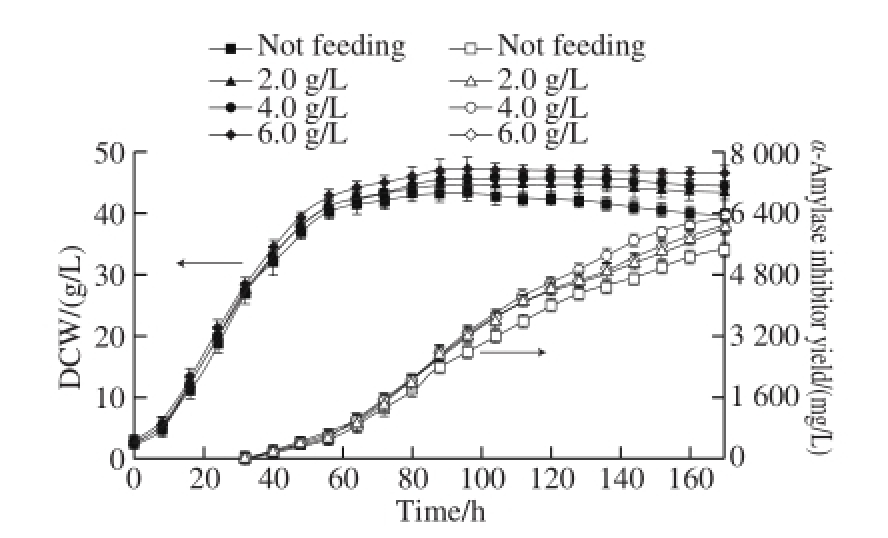
Fig.7 Effect of sodium glutamate concentration on α-amylase inhibitor production
As shown in Fig. 7, when the concentration of the sodium glutamate was increased, the microbial accumulation was increased. When sodium glutamate concentration was 4.0 g/L, DCW of the S. coelicof l avus ZG0656 were increased by 45.7 g/L and 5.4%, respectively as compared to those without adding glutamate. The microbial accumulation would be continually increased when the concentration of sodium glutamate was gradually increased in the fermentation process, but when no sodium glutamate was added, the biomass in the latter part of fermentation would be slowed down. When the sodium glutamate concentration was 4.0 g/L, the α-amylase inhibitor yield reached the maximum value of 6 322 mg/L, and increased by 16.3% as compared to that without adding sodium glutamate. When the sodium glutamate concentration was further increased to 6.0 g/L, the fi nal α-amylase inhibitor yield was signif i cantly decreased to 6 051 mg/L.
2.2.3 Impacts of sodium glutamate on the metabolic fl ux of the α-amylase inhibitor
Table5 The concentrations and reactions rates of metabolites during the middle and late periods of fermentation

?
α-Amylase inhibitor fed-batch fermentation process curve in 5 L jar fermentor was shown in Fig. 7. S. coelicoflavus ZG0656 growth into the stable phase after 80 h, and the intracellular metabolism was in a quasi-steady state. The producing rates of reducing sugar, acetic acid, lactic acid, six amino acids (aspartic acid, glutamic acid, tryptophan, histidine, tyrosine and valine) and α-amylase inhibitor in the steady period of fermentation were determined and the results were shown in Table 5.

Fig.8 Metabolic network for α-amylase inhibitor biosynthesis during the middle and late periods of fermentation
The metabolic fl ow distributions of α-amylase inhibitor during the middle and late fermentation periods were obtained by LINGO. The results were shown in Fig. 8.
As shown in Fig. 8, without adding sodium glutamate, the flux distributions of HMP, EMP and α-amylase inhibitor synthesis pathway were 7.49, 91.27 and 1.84, respectively. When the sodium glutamate concentration was 4.0 g/L, the fl ux distribution of HMP was 10.18, the fl ux distribution of EMP was 86.64 and the fl ux distribution of α-amylase inhibitor synthesis pathway was 3.18. Therefore, during the process of fermentation, the sodium glutamate concentration was maintained up to 4.0 g/L, which can promote carbon source fl ows into α-amylase inhibitor synthesis, thus, the metabolic fluxes of HMP and α-amylase inhibitor synthesis were increased.
3 Conclusion
α-Amylase inhibitor metabolic pathways were established and analyzed, and optimal metabolic pathway for α-amylase inhibitor biosynthesis was determined, and the key nodes for α-amylase inhibitor biosynthesis were analyzed. Through the optimization of the concentration of sodium glutamate in culture medium, the yield of α-amylase inhibitor was improved. During the fermentation process, the monosodium glutamate was conducive to the growth of bacteria and to the synthesis pathway of carbon flow of HMP pathway and α-amylase inhibitor. By adding sodium glutamate during the fermentation, α-amylase inhibitor concentration was 6 322 mg/L, and the flux distribution of α-amylase inhibitor synthesis pathway was 3.18.
[1] WEHMEIER U F, PIEPERSBERG W. Biotechnology and molecular biology of the α-glucosidase inhibitor acarbose[J]. Applied Microbiology and Biotechnology, 2004, 63(6): 613-625. DOI:10.1007/ s00253-003-1477-2.
[2] LAUBE H. Acarbose: an update of its therapeutic use in diabetes treatment[J]. Clinical Drug Investigation, 2002, 22(3): 141-156. DOI:10.2165/00044011-200222030-00001.
[3] BALFOUR J A, MCTAVISH D. Acarbose: an update of its pharmacology and therapeutic use in diabetes mellitus[J]. Drugs, 1993, 46(6): 1025-1054. DOI:10.2165/00003495-199346060-00007.
[4] CHIASSON J L, JOSSE R G, GOMIS R, et al. Acarbose for prevention of type 2 diabetes mellitus: the STOP-NIDDM randomized trial[J]. The Lancet, 2002, 359: 2072-2077. DOI:10.1007/s00125-004-1409-4.
[5] DELORME S, CHIASSON J L. Acarbose in the prevention of cardiovascular disease in subjects with impaired glucose tolerance and type 2 diabetes mellitus[J]. Current Opinion in Pharmacology, 2005, 5(2): 184-189. DOI:10.1016/j.coph.2004.11.005.
[6] ZHANG R X, YANG F Y, ZHUO W H, et al. Research progress of acarbose[J]. Qilu Pharmaceutical Affairs, 2012, 6: 360-362.
[7] BONARIUS H P J, SCHMID G, TRAMPER J. Flux analysis of underdetermined metabolic networks: the quest for the missing constraints[J]. Trends in Biotechnology, 1997, 15: 308-314. DOI:10.1016/S0167-7799(97)01067-6.
[8] van GULIK W M, HEIJNEN J J. A metabolic network stoichiometry analysis of microbial growth and product formation[J]. Biotechnology and Bioengineering, 1995, 48(6): 681-698. DOI:10.1002/ bit.260480617.
[9] CHEN N, DU J, LIU H, et al. Elementary mode analysis and metabolic flux analysis of L-glutamate biosynthesis by Corynebacterium glutamicum[J]. Annals of Microbiology, 2009, 59: 317-322. DOI:10.1007/BF03178334.
[10] JIANG W, SHENG Y T, CAI Y M, et al. Comprehensive effects of maltose concentration and medium osmotic pressure on acarbose in Actinoplanes sp. fermentation[J]. Chinese Journal of Pharmaceuticals, 2010, 41(3): 178-182.
[11] SCHUSTER S, DANDEKAR T, FELL D A. Detection of elementary flux modes in biochemical networks: a promising tool for pathway analysis and metabolic engineering[J]. Trends in Biotechnology, 1999, 172(2): 53-60. DOI:10.1016/S0167-7799(98)01290-6.
[12] SCHUSTER S, FELL D, DANDEKA T. A general definition of metabolic pathways useful for systemic organization and analysis of complex metabolic networks[J]. Nature Biotechnology, 2000, 18: 326-332. DOI:10.1038/73786.
[13] SCHUSTER S, KLAMT S, WECKWERTH W, et al. Use of network analysis of metabolic systems in bioengineering[J]. Bioprocess and Biosystems Engineering, 2002, 24(6): 363-372. DOI:10.1007/ s004490100253.
[14] SEE S M, DEAN J P, DERVAKOS G. On the topological features of optimal metabolic pathway regimes[J]. Applied Biochemistry and Biotechnology, 1996, 60: 251-301. DOI:10.1007/BF02783588.
[15] SHIIO I, SASAKI A, NAKAMORI S, et al. Production of L-isoleucine by AHV resistant mutants of Brevibacterium fl avum[J]. Agricultural and Biological Chemistry, 1973, 37: 2053-2061. DOI:10.1080/000213 69.1973.10860948.
[16] STEPHANOPOULOS G, ARISTIDOU A A, NIELSEN J H. Metabolic engineering-principles and methodologies[M]. San Diego: Academic Press, 1998: 21-79.
[17] STEPHANOPOULOS G, VALLINO J J. Network rigidity and metabolic engineering in metabolite overproduction[J]. Science, 1991, 252(5013): 1675-1681. DOI:10.1126/science.1904627.
[18] VALLINO J J, STEPHANOPOULOS G. Metabolic fl ux distributions in Corynebacterium glutamicum during growth and lysine overproduction[J]. Biotechnology and Bioengineering, 1993, 41(6): 633-646. DOI:10.1002/bit.260410606.
[19] KLAMT S, STELLING J. Two approaches for metabolic pathway analysis[J]. Trends in Biotechnology, 2003, 21(2): 64-69. DOI:10.1016/S0167-7799(02)00034-3.
[20] GAGNEUR J, JACKSON D B, CASARI G. Hierarchical analysis of dependency in metabolic networks[J]. Bioinformatics, 2003, 19(8): 1027-1034. DOI:10.1093/bioinformatics/btg115.
[21] DANDEKAR T, MOLDENHAUER F, BULIK S, et al. A method for classifying metabolites in topological pathway analyses based on minimization of pathway number[J]. BioSystems, 2003, 70(3): 255-270. DOI:10.1016/S0303-2647(03)00067-4.
[22] SCHILLING C H, LETSCHER D, PALSSON B Ø. Theory for the systemic def i nation of metabolic pathways and their use in interpreting metabolic function from a pathway-oriented perspective[J]. Journal of Theoretical Biology, 2000, 203(3): 229-248. DOI:10.1006/ jtbi.2000.1073.
[23] SCHILLING C H, PALSSON B Ø. Assessment of the metabolic capabilities of Haemophilus influenzae Rd through a genomic scale pathway analysis[J]. Journal of Theoretical Biology, 2000, 203(3): 249-283. DOI:10.1006/jtbi.2000.1088.
[24] SCHUSTER S, KLAMT S, WECKWERTH W, et al. Use of network analysis of metabolic systems in bioengineering[J]. Bioprocess and Biosystems Engineering, 2002, 24(6): 363-372. DOI:10.1007/ s004490100253.
[25] BARTEK T, MAKUS P, KLEIN B, et al. Inf l uence of L-isoleucine and pantothenate auxotrophy for L-valine formation in Corynebacterium glutamicum revisited[J]. Bioprocess and Biosystems Engineering, 2008, 31(3): 217-225. DOI:10.1007/s00449-008-0202-z.
[26] ZHANG C S, PODESCHWA M, ALTENBACH H J, et al. The acarbose-biosynthetic enzyme AcbO from Actionplanes sp. SE 50/110 is a 2-epi-5-epi-valiolone-7-phosphate 2-epimerase[J]. FEBS Letters, 2003, 540(1/2/3): 47-52. DOI:10.1016/S0014-5793(03)00221-7.
[27] LEE S, EGELKROUT E. Biosynthetic studies on the alpha-glucosidase inhibitor acarbose in Actinoplanes sp.: glutamate is the primary source of the nitrogen in acarbose[J]. The Journal of Antibiotics, 1998, 51(2): 225-227. DOI:10.7164/antibiotics.51.225.
α-淀粉酶抑制剂生物合成途径和代谢流分析
张洪志
1,徐庆阳
1,曹华杰
1,白 芳
2,陈 宁
1,白 钢
2,*
(1.天津科技大学生物工程学院,代谢控制发酵技术国家地方联合工程实验室,天津 300457;2.南开大学药学院,天津 300071)
摘 要:为提高糖类的利用效率,加强糖类代谢向生成α-淀粉酶抑制剂的方向流动,提高α-淀粉酶抑制剂产量,对天蓝黄链霉菌合成α-淀粉酶抑制剂的代谢网络进行分析,找出影响α-淀粉酶抑制剂合成的代谢流量分配规律和关键节点,并且应用代谢流分析的方法研究了谷氨酸钠对α-淀粉酶抑制剂发酵中后期胞内代谢流分布的影响。结果表明:在α-淀粉酶抑制剂分批发酵过程中,未流加谷氨酸钠时合成α-淀粉酶抑制剂的代谢流量为1.84;在发酵培养基中流加谷氨酸钠使其质量浓度维持在4.0 g/L后,α-淀粉酶抑制剂生物合成的代谢流增长至3.18。因此发酵过程中流加谷氨酸钠能够改变α-淀粉酶抑制剂生物合成途径的关键节点6-磷酸葡萄糖、7-磷酸景天庚酮糖及谷氨酸的代谢流分布,提高α-淀粉酶抑制剂生物合成途径的代谢流量。
关键词:α-淀粉酶抑制剂;代谢流分析;谷氨酸钠
中图分类号:Q935
文献标志码:A
文章编号:1002-6630(2017)04-0118-07
References:
引文格式:
收稿日期:2016-03-21
基金项目:天津市应用基础与前沿技术研究计划项目(14JCYBJC28500)
作者简介:张洪志(1988—),男,硕士,研究方向为生物工程。E-mail:zhanghongzhi125@sina.com
DOI:10.7506/spkx1002-6630-201704020
ZHANG Hongzhi, XU Qingyang, CAO Huajie, et al. Application of biosynthesis pathway analysis and metabolic flux analysis for optimization of fermentation of α-amylase inhibitor[J]. 食品科学, 2017, 38(4): 118-124.
DOI:10.7506/ spkx1002-6630-201704020. http://www.spkx.net.cn
ZHANG Hongzhi, XU Qingyang, CAO Huajie, et al. Application of biosynthesis pathway analysis and metabolic flux analysis for optimization of fermentation of α-amylase inhibitor[J]. Food Science, 2017, 38(4): 118-124. DOI:10.7506/ spkx1002-6630-201704020. http://www.spkx.net.cn
*通信作者:白刚(1968—),男,教授,博士,研究方向为药学。E-mail:gangbai@nankai.edu.cn