Honeysuckle (Lonicerae japonicae Flos) is a traditional Chinese herb and favorite cool tea material. It contains many nutrient components, including phenols, flavonoid,sugar, triterpenes, essential oil and mineral substance, and has multifaceted healthcare effects, including antibiosis, antiinflammatory, heat-clearing, and detoxification[1-3]. In the recent years, honeysuckle is widely used in herbal tea, beverage,granules and other food industries[4]. With growing demand of honeysuckle, the quality requirements for honeysuckle become stricter gradually.
Since honeysuckle is rich in phenolic compounds and polyphenoloxidase, it is easy to produce enzymatic browning in honeysuckle during picking, drying, and storage etc.[5-6],resulting in serious quality degradation. Therefore, several pretreatment methods are usually applied to inhibit enzymatic browning inside honeysuckle[1,5], such as steam blanching, liquid soaking, sulfur fumigation. Among them, sulfur fumigation is a traditional pretreatment method for crops. Sulfur dioxide generated by combustion could react with water on the surface of materials to generate sulfurous acid, which could inhibit enzymatic browning based on its characteristics of anti-oxidation, inhibiting enzyme activity and sterilization[7].However, this approach can easily lead to excessive sulfur content in agricultural products, triggering chemical transformations and reducing nutritional value. Therefore,the government has put forward strict requirements on the treatment of sulfur fumigation and residual sulphur content in agricultural products[8-9]. However, in order to earn exorbitant profits, some unscrupulous traders and producers secretly adopt sulfur fumigation method to inhibit the enzymatic browning of honeysuckle and maintain product color, despite national criterion for sulfur content. Such behavior can easily cause excessive sulfur residue, reducing the nutritional value of honeysuckle and producing negative impact on consumer health. But, the appearances of honeysuckle products with or without sulfur fumigation treatment are very similar, and the sulfur content of honeysuckle cannot be effectively judged by sensory evaluation. Therefore, in order to protect the quality of honeysuckle products and maintain the normal honeysuckle market, it is essential to establish an effective and practical method for detecting sulfur content in honeysuckle.
The traditional sulfur content detection and identification methods include high performance liquid chromatography(HPLC)[10], acid distillation titration[11], and colorimetric[12], etc.While these methods could achieve high accuracy, they have several defects, such as high operation requirements, tedious steps, and long test period. Hyperspectral imaging technology is an innovative detection method, which combines imaging technology and spectroscopy technology to obtain spectral and spatial information on internal and external quality characteristics simultaneously. It has the characteristics of rapid,non-destructive and accurate detection[13], which is expected to solve the problem of complicated operation and lengthy period for those conventional detection methods of sulfur content.Nowadays, hyperspectral technology has been widely used in identification of agricultural products and rapid non-destructive quality evaluation[14-16]. However, up to now, the studies on rapid and nondestructive detection of sulfur fumigation and sulfur residues in agricultural products by hyperspectral imaging have rarely been reported.
Therefore, in this study, honeysuckle samples were used to explore rapid and nondestructive detection method of honeysuckle samples with different sulfur contents based on hyperspectral imaging technology. Firstly, the spectral information for honeysuckle with different sulfur fumigation levels was collected by using a hyperspectral line scan imaging equipment. Then, different methods for noise removal and characteristic wavelengths extraction were conducted and compared. Finally, hyperspectral detection model was developed based on kernel Fisher discrimination analysis (KFDA) with the application of Wilks criterion. This research could provide practical reference for rapid, non-destructive and accurate identification of different sulfur residues in honeysuckle.
Fresh honeysuckle samples for the experiments were collected from Liugou honeysuckle planting base in Luoyang,Henan Province. The samples with similar size, green color and no pest-disease were selected for the experiments. In each experiment, four groups of fresh honeysuckle samples of (30 ± 0.2) g for each group were put on four reticular disks and then those disks were placed into four glass sealing tanks(30 cm in diameter and 30 cm in height). Industrial sulfur materials with 0.5%, 1.0%, and 1.5% of the weight of fresh honeysuckle samples were put into the bottom of three tanks,respectively. The sulfur materials were ignited for 1 h sulfur fumigation, and then, both the sulfur-fumigated honeysuckle samples and the samples without sulfur fumigation were taken out and placed inside a hot air dryer (101-3ES, Beijing Yongguangming Co.) for drying 15 h at 50 ℃. The sulfur residues in dried honeysuckle samples were determined according to GB/T 5009.34—2016 The determination of sulfur dioxide in food[17]. Each experiment was conducted in triplicates.
1.2.1 Hyperspectral imaging system
The hyperspectral imaging system used in this study consists of a spectrograph-based hyperspectral camera, an imaging spectrometer (Inno-Spec IST50-3810, Germany),a lens, four 500 W optical fiber halogen lamps (ESYLUX 90000420108, Germany), a conveyor belt controlled by a highprecision motor, a computer and a black box[18-19]. The imaging spectrometer has an acquisition range of 371–1 028 nm,with 1 288 bands in the spectral range and a spectral resolution of 2.8 nm.
1.2.2 Hyperspectral image acquisition
In order to guarantee image resolution and avoid image distortion, the objective lens distance and the exposure time of the hyperspectral camera and the moving speed of the conveying device should be determined before the image acquisition. After repeated adjustments, the objective lens height, the CCD camera exposure time for each hyperspectral image and the movement speed of carrier platform were determined as 300 mm, 90 ms and 1.00 mm/s, respectively.Image acquisition was achieved by exploiting hyperspectral imaging system acquisition software (Wuling Optical,Taiwan, China) and image data was processed by using the analysis software ENVI 5.1 (ITT, Visual Information Solutions) and MATLAB R2014a (The Math Works, Natick,USA).
Due to the inhomogeneous distribution of the light intensity at various wavelengths and the dark current of the sensor, the obtained images usually contained a large amount of noise in a wavelength band with weak light intensity distribution.In order to solve the problem, the calibration should be performed for hyperspectral images. Under the system condition which was as same as that of sample acquisition, the standard white calibration board with reflectance of 99% was scanned to obtain an entirely white calibration image. Then,the camera shutter was closed for image acquisition to receive a completely black calibration image. Finally, according to the equation (1), the image standardization was conducted to translate the acquisition of the absolute image into a relative image[20].
Where R is calibrated hyperspectral image; I is the original hyperspectral image; B is the whole black image;W is the all white image.
The whole honeysuckle sample was extracted as the region of interest (ROI) from the calibrated hyperspectral data, and the average spectral values of all the pixels in the ROI were taken as the spectral values of the corresponding sample. The ROIs of all the calibrated images were extracted using the software ENVI 5.1.
1.2.3 Data processing
The intent of Fisher discriminant analysis (FDA) is to outcrop the most easily-graded projection line in the original sample space based on actual situation. The basic idea of FDA is to minimize the intra-class distance of samples and maximize the distance between classes[21-23]. This method can effectively merge the classification information of training samples and extract features based on classification ability.
KFDA is an innovative extraction method of non-linear feature which combines the idea of nuclear learning with FDA.First, the data in the original space are mapped into a highdimensional kernel space through a nonlinear mapping in which a linear FDA is performed by introducing a kernel function[24-26].In this way, the obtained sample features are non-linear features relative to the original space, and these non-linear features are more conducive to classification. Gaussian function was used as the kernel function in this research.
Hyperspectral data usually have problems of high dimension and numerous data for data processing, which is time-consuming and inefficient. In order to solve these problems, the characteristic wavelengths selection is essential for increasing the performance of the prediction model.The regression coefficient (RC) is the spectral signal change caused by the change of the unit concentration of the tested component[27]. Larger absolute values of the regression coefficient represent a better linear relationship between absorbance and concentration and higher sensitivity. Large weighted regression coefficients values located at peaks or troughs of the bands were considered carrying more determination power and thus preferred as optimal wavelengths,while those with small weighted regression coefficient’s values were regarded as irrelevant and detrimental and were completely neglected. In order to solve the problem of the relatively complex prediction model based on full-band spectrum, dimension reduction should be conducted for the whole bands and the wavelengths with irrelevant information and noise should be eliminated, and then the characteristic wavelengths with the most useful information and the high signal-noise ratios should be selected.
The Wilks criterion can be used to examine the discriminant ability of various variables in multiple samples and the classification effect of the samples. The Wilks values reflect the effect of a certain principal component on classification.Valid information that is most conducive to the classification of samples is extracted to increase the discrimination performance[28-30]. The main calculation of Wilks criterion is as follows (equation (2), (3)).
Let ‘m’ represent the number of selected eigenvectors,then:
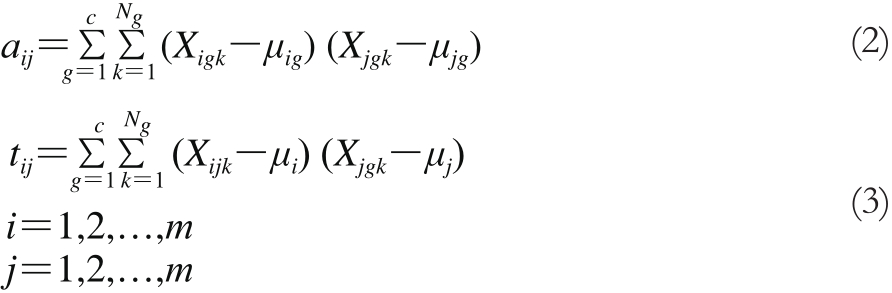
Where c represents the number of sample categories;Ngrepresents the number of samples in category g; Xigkand Xjgkrepresent the elements in the principal component matrix of the sample data array; μigand μjgare the mean values corresponding to Xigkand Xjgk, respectively; μjrepresent the overall mean values of the principal component elements corresponding to the ith μiand j eigenvectors, respectively.
Wilks criterion defines the ratio between the determinant values of matrix A and T as the deviation ratio, denoted as Λ,and as shown in equation (4):
Where T is the total deviation of each column of the principal component matrix obtained during the calculation of the characteristic parameter kernel of honeysuckle, and A is the intra-group deviation of the values of each column in the principal component matrix. When the A value is small and the T value of is large, the value of Λ is small, indicating that the principal component is conducive to classification.
Within the processes of training and prediction, the performance of a calibration model is usually evaluated in terms of root mean square error (RMSE) of training and coefficients of determination (R2) in the calibration process.Generally, a good model should have higher values of R2,lower values of RMSE, and shorter time. The data processing methods and results in this paper were obtained through MATLAB software.
In this experiment, there were four groups of samples,including the non-fumigated and three groups of sulfurfumigated honeysuckle samples with different sulfur fumigation levels. The experiment was conducted with reference to the operation in the literature[17]. It was determined that the average amount of residual sulfur of honeysuckle with 0%, 0.5%, 1%and 1.5% sulfur fumigation levels were (1.2 ± 0.2), (316.8 ± 3),(572.5 ± 8) mg/kg and (965.8 ± 6) mg/kg, respectively. Chinese Pharmacopoeia states that sulfur-fumigated samples can be divided into non-fumigated samples, slight sulfur-fumigated samples, excessive sulfur-fumigated samples and serious excessive samples, and the sulfur residue of sulfur-fumigated samples should be lowere than 400 mg/kg[9]. For the first three groups, the color was light green with minor differences, and it was rarely straightforward to identify the three groups. The color of the fourth group was yellow-green, and the color of samples would change to bright yellow when the sulfur dosage continues to increase. The samples of the first three groups showed a characteristic flavor of honeysuckle, while the smell of the fourth group began to mix with a little sulphuric flavor.It could be seen that the sulfur content of the fourth group exceeded the Pharmacopoeia’s standard, and this group can be distinguished from the other three groups through sensory discrimination. The accurate discrimination of the first three groups was difficult because of similar appearance and flavor.The sulfur content of the third group also surpassed the Pharmacopoeia’s standard, and it was difficult to discriminate effectively with the samples with low sulfur content and the non-sulfur-fumigated samples. Therefore, it is necessary to take a more effective method to solve the inadequacy of artificial judging.
The samples of each group were scanned using the hyperspectral system and 1 288 continuous bands from spectral range of 371–1 088 nm were acquired, and the low signalto-noise ratios at the front and back of the spectral data were removed. Therefore, a total of 1 029 bands within the range from the band 90–1 118 were selected, which was, the spectra in the range of 416–940 nm were selected for further analysis.The average spectral reflectance of each group was shown in Fig. 1. There were the same general trend of the average spectral reflectance values and characteristic absorption among the four groups of samples, and the reflectance values tended to coincide at partial band ranges. Therefore, it was arduous to distinguish the four groups of samples directly from the original spectrum.

Fig. 1 Mean spectra of four groups of honeysuckle samples
In order to improve the prediction accuracy of the model, class assignment was applied to assign the four groups of samples, and the random method was applied to compartmentalize the training set and prediction set in a ratio of 2:1 from the tested 360 honeysuckle samples. Finally, 240 training samples and 120 prediction samples were determined.The results of the division of training set and prediction set were shown in Table 1.
Table 1 Class assignment and division of training and prediction sets of honeysuckle
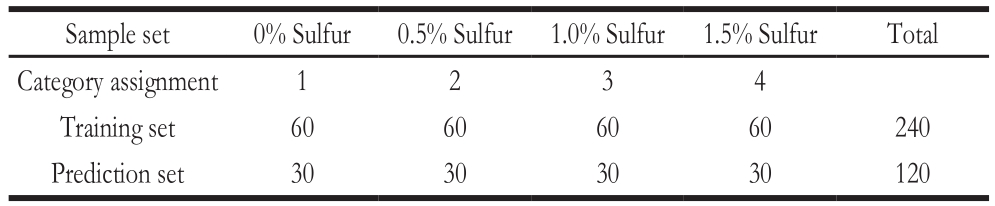
Sample set 0% Sulfur 0.5% Sulfur 1.0% Sulfur 1.5% Sulfur Total Category assignment 1 2 3 4 Training set 60 60 60 60 240 Prediction set 30 30 30 30 120
In order to improve discrimination performance and remove noise, it is necessary to conduct the pretreatment for original spectral data obtained from hyperspectral images before model establishment. Therefore, for a total of 360 randomly selected honeysuckle samples, three pretreatments of multiple scatter correct (MSC), standard normal variate transformation(SNV) and Savitzky-Golay (S_G) filter (the window width was set to 6 points and quadratic polynomial in this paper)were applied before the development of partial least square regression (PLSR) models. The results were shown in Table 2. The R2and RMSE are commonly used as the indicators for evaluating the model quality. In general, the values of R2as close as one and the RMSE as close as zero are considered as good forecasting capacity. As indicated in Table 2, PLSR model based on S_G filter yielded the best results in accuracy with of 0.989 3,
 of 0.895 0 and RMSECV of 0.115 6, RMSEP of 0.362 2. Therefore, the results indicated that S_G filter could exist the most obvious effect on noise removal in this research and could be considered as the superior pretreatment method for the discrimination model of honeysuckle’s sulfur contents.
Table 2 Prediction results of PLS models with different preprocessing methods based on full-range spectra
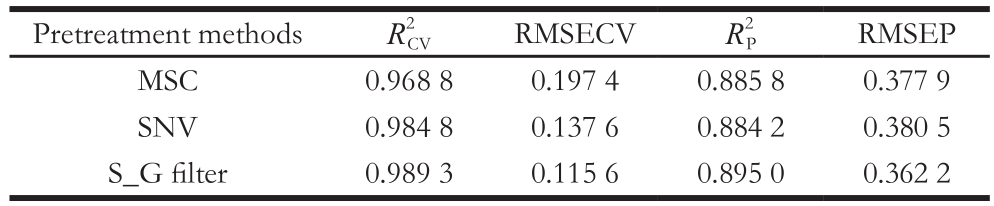
Note: denote the correlation coefficients of training set and prediction set, respectively; RMSECV and RMSEP represent the root mean square error of the training set and the prediction set, respectively.
RMSEP MSC 0.968 8 0.197 4 0.885 8 0.377 9 SNV 0.984 8 0.137 6 0.884 2 0.380 5 S_G filter 0.989 3 0.115 6 0.895 0 0.362 2 Pretreatment methods R2CVRMSECV R2P
The results of identification models based on FDA and KFDA with full spectrum after S_G filter pretreatment were illustrated in Fig. 2. The FDA identification results were shown in Fig. 2a. The distribution of the four sample groups was extremely dispersed and the boundary between the different samples was not apparent with overlap in some parts. Hence, it was demonstrated that S_G filter could not eliminate all of spectral noise although most of them have been removed by S_G filter. The correct rate and running time of FDA identification were 82.6% and 3.11 s,respectively. Fig. 2b showed the identification results of KFDA, with the core parameter of kernel function of 0.964.The sulfur-fumigated samples of both group 1 and group 2 had obvious dividing lines with other samples. Although intraclass mapping of the sulfur-fumigated samples of group 4 was relatively concentrated, it possessed partial coincidence with the samples of group 3 and the boundary of the two groups weren’t acceptably obvious. The classification accuracy rate and operating time of KFDA were 98.2% and 1.17 s, respectively.Therefore, KFDA was selected for further analysis.
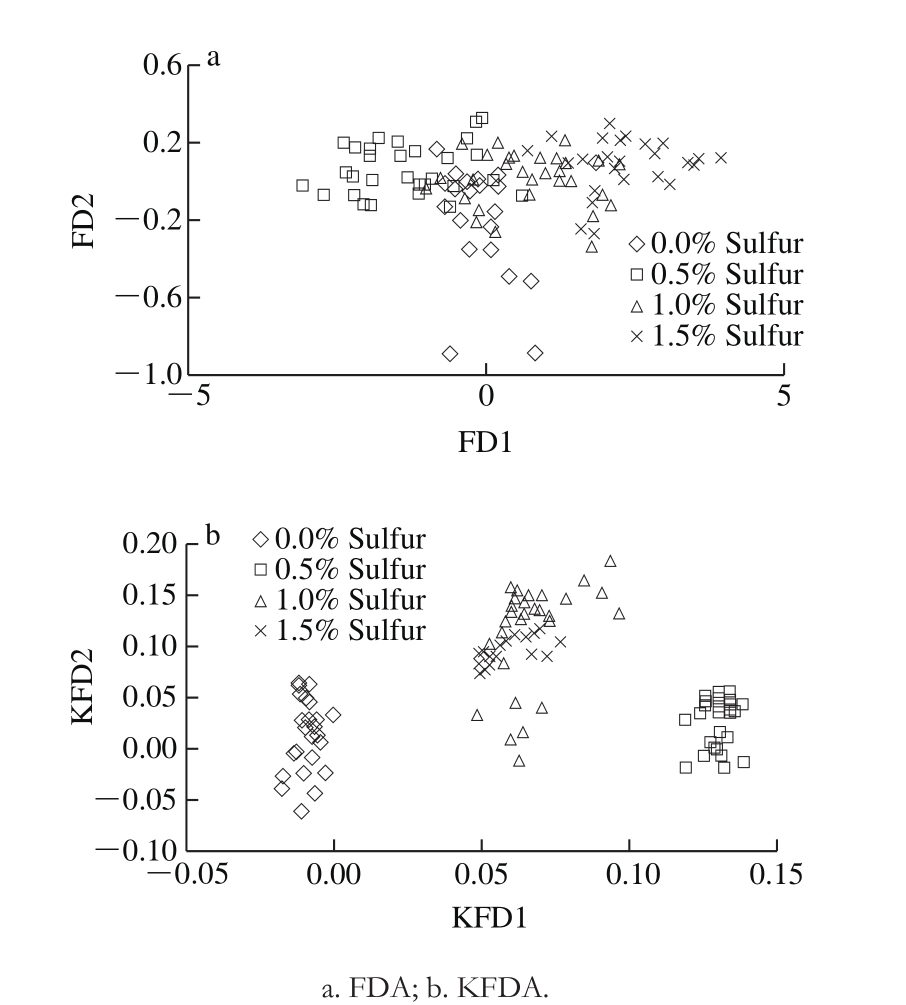
Fig. 2 Discrimination of honeysuckle samples by FDA and KFDA with S_G pretreatment
In this study, RC and Wilks criterion were applied to extract the characteristic wavelengths from the whole spectrum.As a result, the 10 characteristic bands obtained by RC algorithm included 69, 104, 192, 217, 239, 336, 382, 441, 543 and 604 bands, namely 451.9, 469.8, 514.9, 527.7, 539, 588.7,612.2, 642.4, 694.5, and 725.6 nm. Wilks criterion was sorted by descending order according to the characteristic bands and the contribution rate of the band information to choose the first 130 principal components.
Three discriminant models of RC-KFDA, Wilks-KFDA and RC-Wilks-KFDA based on S_G filter pretreatment were established, respectively. As illustrated in Fig. 3, with different methods of extracting characteristic wavelengths, the samples of four groups could be well separated with clear dividing lines,and all the correct rates of classification reached 100%. In Fig.3a, based on RC-KFDA, it was indicated that the intra-class distribution of samples was more dispersed, with the operating time of 0.43 s. Fig. 3b and Fig. 3c showed the results of Wilks-KFDA and RC-Wilks-KFDA, respectively, which showed that the four honeysuckle samples were concentrated, with running times of 1.40 s and 0.69 s, respectively.
Comparing with Fig. 3a and Fig. 2b, it could be seen that the characteristic wavelengths extracted by RC preserved a significant part of the band information, eliminating the influence of a large amount of noise information and improving the classification accuracy of the samples consequently.As can be seen from Fig. 3a and Fig. 3c, the arrangement order of the contribution rates of the selected characteristic wavelengths had certain influence on the KFDA classification effect. In terms of running time, the comparison of the running time required by the three modeling methods in Fig. 3 was in the order as follows: Wilks-KFDA > RCWilks-KFDA > RC-KFDA. The running time of RC-Wilks-KFDA was 0.26 s slower than that of RC-KFDA and 0.71 s faster than that of Wilks-KFDA. Although the running time of RC-Wilks-KFDA was a slightly slower than that of RC-KFDA,the performance of its model classification was the best among the three models. Yin Yong et al.[28]introduced the Wilks criterion into the principal component analysis (PCA)of wine identification, and the problem of over-elimination of the correlation between the variables with sole PCA could be solved by applying Wilks criterion. Yu Huichun et al.[31]introduced a method of screening principal components based on Wilks Λ statistics, and the results showed that the KFDA discriminant analysis based on the Wilks Λ could achieve better classification results. In this study, the classification results of RC-Wilks-KFDA could also obtain optimal results, which represented that application of Wilks criterion could increase the discrimination performance of identification model.Therefore, fast, non-destructive and accurate identification of different sulfur residues in honeysuckle could be achieved using RC-Wilks extracted characteristic spectra to establish the discriminant model of KFDA.
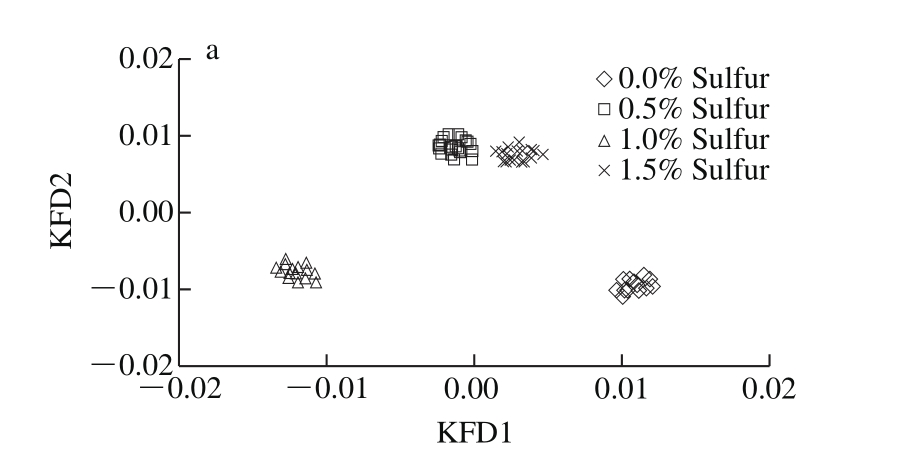
Fig. 3 Results of KFDA identification with characteristic wavelengths
The hyperspectral information of four sample groups of including the non-fumigated honeysuckle and sulphurfumigated honeysuckle samples with three different sulfur fumigation levels was obtained with hyperspectral technology.A rapid and non-destructive method for the determination of different sulfur contents in honeysuckle was studied. By comparing the three pretreatment methods, including S_G filter, SNV and MSC, S_G filter was found to be the best pretreatment method, with R2and RMSE values for the prediction set of 0.895 0 and 0.362 2, respectively. Subsequently,the models of FDA and KFDA were established by using the full spectral information with S_G filter pretreatment, and the KFDA model was better for the classification of honeysuckle with different sulfur contents. The order of contribution rate of characteristic wavelengths had certain effect on the effect of KFDA classification by comparing three methods of extracting characteristic spectrum, and all the discriminant accuracy values could achieve 100%, which was obviously superior to that of the full wavelength model. A comparison was made among the three models based on characteristic wavelengths spectrum.Compared with the Wilks-KFDA model, the running time of RC-Wilks-KFDA model increased 0.71 s. Compared with the RC-KFDA model, the intra-class mapping of RC-Wilks-KFDA model was more centralized and practical in spite of a little longer running time. Therefore, the S_G-RC-Wilks-KFDA model based on hyperspectral imaging technology could achieve a rapid, nondestructive and accurate detection of honeysuckle samples with different sulfur-fumigated degrees.
[1] YANG X Y, LIU Y L, HOU A J, et al. Systematic review for geoauthentic Lonicerae japonicae Flos[J]. Frontiers of Medicine, 2017,11(2): 203-213. DOI:10.1007/s11684-017-0504-0.
[2] ZHOU Y L, ZHOU T, PEI Q. Pharmacokinetics and tissue distribution study of chlorogenic acid from Lonicerae japonicae Flos following oral administrations in rats[J]. Evidence-Based Complementary and Alternative Medicine, 2014(6): 1-7. DOI:10.1155/2014/979414.
[3] GUO Y P, LIN L G, WANG Y T. Chemistry and pharmacology of the herb pair Flos Lonicerae japonicae-Forsythiae fructus[J]. Chinese Medicine, 2015, 10(16): 1-11. DOI:10.1186/s13020-015-0044-y.
[4] SHANG X, PAN H, LI M, et al. Lonicera japonica Thunb.:ethnopharmacology, phytochemistry and pharmacology of an important traditional Chinese medicine[J]. Journal of Ethnopharmacology, 2011,138(1): 1-21. DOI:10.1016/j.jep.2011.08.016.
[5] KANG X Y. Research on drying technology and phenolics browning mechanism of honeysuckle[D]. Luoyang: Henan University of Science and Technology, 2016: 18.
[6] CARTER M Q, CHAPMAN M H, GABLER F, et al. Effect of sulfur dioxide fumigation on survival of foodborne pathogens on table grapes under standard storage temperature[J]. Food Microbiology, 2015, 49:189-196. DOI:10.1016/j.fm.2015.02.002.
[7] XU Q. Effect of sulfur fumigation on ensuring curative effect of Lonicera japonica Thunb.[D]. Zhengzhou: Henan University of Chinese Medicine, 2011: 16.
[8] CHEN H Z, LI Y J. Survey of rapid testing method for sulfur dioxide residues in traditional Chinese medicine and analyses to the solutions[J].China Medicine and Pharmacy, 2014, 4(18): 15-19.
[9] Committee for the Pharmacopoeia of PR China. Pharmacopoeia of PR China[M]. Beijing: China Medical Science and Technology Press, 2015:28-29; 205-206.
[10] LI S L, SHEN H, ZHU L Y, et al. Ultra-high-performance liquid chromatography-quadrupole/time of flight mass spectrometry based chemical profiling approach to rapidly reveal chemical transformation of sulfur-fumigated medicinal herbs, a case study on white ginseng[J].Journal of Chromatography A, 2012, 1231: 31-45. DOI:10.1016/j.chroma.2012.01.083.
[11] DONG Q, ZHAO X M, ZHAO L, et al. Determination of sulfur dioxide in honeysuckle by acid distillation-iodimetric titration[J]. Research and Practice on Chinese Medicines, 2014, 28(5): 58-60.
[12] WU M Y, HE T, LI K, et al. A real-time colorimetric and ratiometric fluorescent probe for sulfite[J]. Analyst, 2013, 138(10): 3018-3025.DOI:10.1039/C3AN00172E.
[13] FENG C H, MAKINO Y, QSHITAA S, et al. Hyperspectral imaging and multispectral imaging as the novel techniques for detecting defects in raw and processed meat products: current state-of-the-art research advances[J]. Food Control, 2017, 84: 165-176. DOI:10.1016/j.foodcont.2017.07.013.
[14] WU D, SUN D W. Advanced applications of hyperspectral imaging technology for food quality and safety analysis and assessment: a review-part I: fundamentals[J]. Innovative Food Science & Emerging Technologies, 2013, 19: 1-14. DOI:10.1016/j.ifset.2013.04.014.
[15] MOLLAZADE K. Non-destructive identifying level of browning development in button mushroom (Agaricus bisporus) using hyperspectral imaging associated with chemometrics[J]. Food Analytical Methods, 2017, 10(8): 2743-2754. DOI:10.1007/s12161-017-0845-y.
[16] LIU Y W, PU H B, SUN D W. Hyperspectral imaging technique for evaluating food quality and safety during various processes: a review of recent applications[J]. Trends in Food Science & Technology, 2017, 69:25-35. DOI:10.1016/j.tifs.2017.08.013.
[17] National Health and Family Planning Commission of PRC. National food safety standard: the determination of sulfur dioxide in food: GB/T 5009.34—2016[S]. Beijing: Standard Press of China, 2016: 1-3.
[18] SUN Y, LIU Y H, YU H C, et al. Non-destructive prediction of moisture content and freezable water content of purple-fleshed sweet potato slices during drying process using hyperspectral imaging technique[J]. Food Analytical Methods, 2017, 10(5): 1535-1546. DOI:10.1007/s12161-016-0722-0.
[19] QIN J W, CHAO K L, KIM M S, et al. Hyperspectral and multispectral imaging for evaluating food safety and quality[J].Journal of Food Engineering, 2013, 118(2): 157-171. DOI:10.1016/j.jfoodeng.2013.04.001.
[20] XIE C Q, LI X L, SHAO Y N, et al. Color measurement of tea leaves at different drying periods using hyperspectral imaging technique[J]. PLoS ONE, 2014, 9(12): 1-15. DOI:10.1371/journal.pone.0113422.
[21] CHU X, WANG W, ZHANG L D. Hyperspectral optimum wavelengths and Fisher discrimination analysis to distinguish different concentrations of aflatoxin on corn kernel surface[J]. Spectroscopy and Spectral Analysis,2014, 34(7): 1811-1815. DOI:10.3964/j.issn.1000-0593(2014)07-1811-05.
[22] YU H C, WANG R B, YIN Y, et al. Wavelength selection of hyperspectral image analysis for wolfberry grading based on information entropy[J]. Food Science, 2017, 38(20): 292-299. DOI:10.7506/spkx1002-6630-201720043.
[23] GUO H, ZHANG Q, NSOKE K A. Feature extraction and dimensionality reduction by genetic programming based on the Fisher criterion[J]. Expert Systems, 2008, 25(5): 444-459. DOI:10.1111/j.1468-0394.2008.00451.x.
[24] VOLPI M, PETROPOULOS P G, KANEVSKI M. Flooding extent cartography with landsat TM imagery and regularized kernel Fisher’s discriminant analysis[J]. Computers & Geosciences, 2013, 57: 24-31.DOI:10.1016/j.cageo.2013.03.009.
[25] YE H S, LI Y J, CHEN C, et al. Fast Fisher discriminant analysis with randomized algorithms[J]. Pattern Recognition, 2017, 72: 82-92.DOI:10.1016/j.patcog.2017.06.029.
[26] ZHU Z B, SONG Z H. A novel fault diagnosis system using pattern classification on kernel FDA subspace[J]. Expert Systems with Applications, 2011, 38(6): 6895-6905. DOI:10.1016/j.eswa.2010.12.034.
[27] PAN R R, LUO Y F, WANG C, et al. Classifications of oilseed rape and weeds based on hyperspectral imaging[J]. Spectroscopy and Spectral Analysis, 2017, 37(11): 3567-3572. DOI:10.3964/j.is sn.1000-0593(2017)11-3567-06.
[28] YIN Y, YU H C, CHU B, et al. A sensor array optimization method of electronic nose based on elimination transform of Wilks statistic for discrimination of three kinds of vinegars[J]. Journal of Food Engineering,2014, 127: 43-48. DOI:10.1016/j.jfoodeng.2013.11.017.
[29] ZHANG X W, ZHANG L F, HUANG C P, et al. Fresh and frozenthawed meat discrimination based on FISS imaging spectral data[J].Spectroscopy and Spectral Analysis, 31(8): 2187-2190. DOI:10.3964/j.is sn.1000-0593(2011)08-2187-04.
[30] XIAO B, MAO W H, LIANG X H, et al. Study on varieties identification of kentucky bluegrass using hyperspectral imaging and discriminant analysis[J]. Spectroscopy and Spectral Analysis, 2012, 32(6): 1620-1623.DOI:10.3964/j.issn.1000-0593(2012)06-1620-04.
[31] YU H C, LIU S Q, YIN Y, et al. The research of KFDA based on Wilks Λ criterion for Chinese wolfberry image grading[J]. Journal of Nuclear Agricultural Sciences, 2015, 29(12): 96-102. DOI:10.11869/j.issn.100-8551.2016.01.0096.
基于高光谱技术的金银花硫含量快速检测模型建立