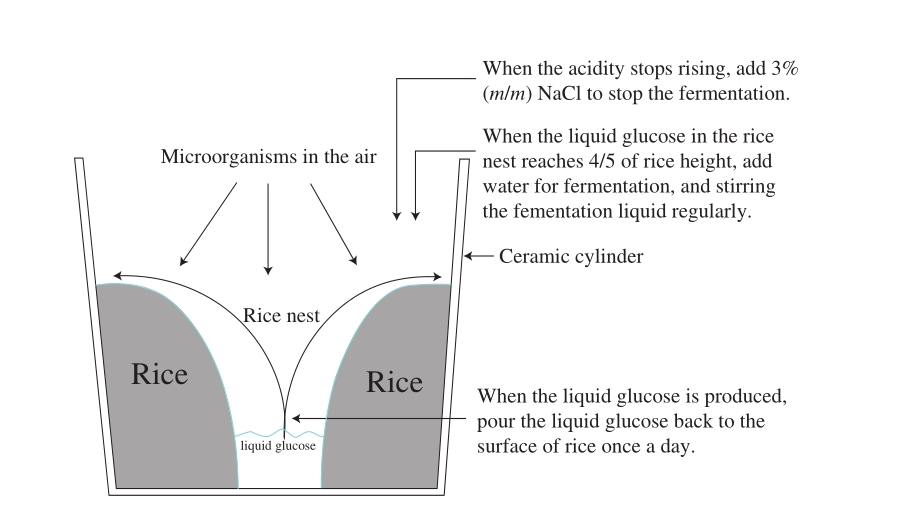
Fig. 1 Schematic diagram of traditional method to produce rosy vinegar
Zhejiang rosy vinegar is a traditional condiment with a long history in Zhejiang Province, China. The name rosy vinegar comes from the fact that the color of vinegar is rosy red[1-2]. At present, all Zhejiang rosy vinegar is purely handmade; during the process of fermentation water is added,due to the effect of heat produced and oxygen consumed by microbial fermentation, it is required to use a harrow to stir and turn over the fermentation mash of rosy vinegar at regular intervals so as to uniformizing the temperature of materials and liquid to bring oxygen in (refer to Fig. 1 for traditional production of rosy vinegar). Since Zhejiang rosy rice-vinegar is purely handmade, its production cost is very high, requiring high labor intensity; besides, it is hard to control the quality,and the product yield is low[1]; therefore, it is hard to create economies of scale. For these reasons, it is required to find a mechanical stirring method to replace manual stirring of vinegar mash, so as to reduce the labor intensity.
However, different stirring methods and stirring frequencies will have different effects on the fermentation process[3-4]. Goksel et al.[5] used the ventilation method to stir fermentation broth and found that the stirring effect was good. Karim et al.[6] found that under different conditions,back flow stirring method and mechanical stirring method had different effects on anaerobic fermentation. Shaoxing Zhiwei Food Co. Ltd. has tried to use the self-suction fermentation method to produce rosy vinegar, but both the color and flavor of its finished products were significantly different from those of rosy vinegar produced by traditional methods[7].In this research, air pumps were used for ventilation and pneumatic stirring of vinegar mash, and different stirring frequencies were designed to produce rosy vinegar, with the aim of researching the effect of different stirring methods and stirring frequencies on microbiological composition during the fermentation process of rosy vinegar, as well as the effect on physicochemical indexes. In addition, the organic acid and volatile components in rosy vinegar after fermentation were also measured to carry out sensory evaluation, and to research the effect of different stirring methods on the taste and flavor of rosy vinegar from multiple aspects. It will be of great significance to the actual production of rosy vinegar.
Sodium chloride, glucose, copper sulfate, ammonium dihydrogen phosphate, phosphoric acid, and sodium chloride were acquired from Sinopsin group chemical reagent Co. Ltd.All of the above reagents are analytical pure.
Methyl alcohol, β-benzene ethanol, ethyl acetate,benzaldehyde, 2-ethyl butyric acidand acetic acid were acquired from Sigma-Aldrich. All of the above reagents were chromatographically pure.
LC-2010AHT high performance liquid chromatography was acquired from Shimazu Instruments, Japan;7890A-5975C gas chromatography-mass spectrometer was acquired from Agilent Technologies Inc.; 50/30 μm DVB/CAR/PDMS SPME fi ber assembly was acquired from Sigma-Aldrich Inc.(US).
1.3.1 Tradational rosy vinegar making
According to the brewing method of local rosy vinegar[8], its brewing process and key steps are shown in Fig. 1. Long-grain rice was soaked for 7 d. After steaming for 30 min and naturally cooling at air temperature, the cooled rice was transferred into a 500 kg ceramic cylinder and formed into a nest, and the surrounding temperature is 25-30 ℃ (April to May). Microorganisms in the air, such as molds, reproduce on the rice, causing the starch in the rice to saccharify. When the liquid glucose is produced in the rice nest, pour the liquid glucose back to the surface of rice once a day for better saccharification. When the liquid glucose in the rice nest reaches 4/5 of rice height (about 15 d after rice was transferred into ceramic cylinder), 300 kg water was added to the ceramic cylinder and stirred well for fermentation, with the surrounding temperature of 25-30 ℃. After elimination,the microorganisms achieved a balance and the raw material is repeatedly saccharified and alcohol fermentation, acetic acid fermentation and the production of flavor substances are also performed. In this process, regular stirring of the fermentation broth is required to dissipate the heat generated by brewing, pass in oxygen and mix the material. When the acidity stops rising (about 3 months after adding water), add 3% (m/m)NaCl to stop the fermentation and aged for 1 month.
Fig. 1 Schematic diagram of traditional method to produce rosy vinegar
1.3.2 Experiment design
In the traditional fermentation process, after adding water, the fermentation liquid was stirred by hand in traditional method (Fig. 2). Because of the high labor intensity and high production cost of manual stirring of fermentation liquid, in this study, pneumatic stirring method was used to stir fermentation liquid (Fig. 3). In order to further study the interactions among the factors, ventilation time and airflow rate were optimized with factorial experiment. Under the best theoretical value of ventilation time and airf l ow rate, the stirring frequency of producing rosy vinegar by pneumatic stirring was explored. After fermentation, the flavor of rosy vinegar produced by traditional method, rosy vinegar produced by pneumatic stirring, and rice vinegar produced by self-absorption fermentation were compared and analyzed.The optimal stirring frequency of pneumatic stirring is selected. The experimental design is shown in Table 1.
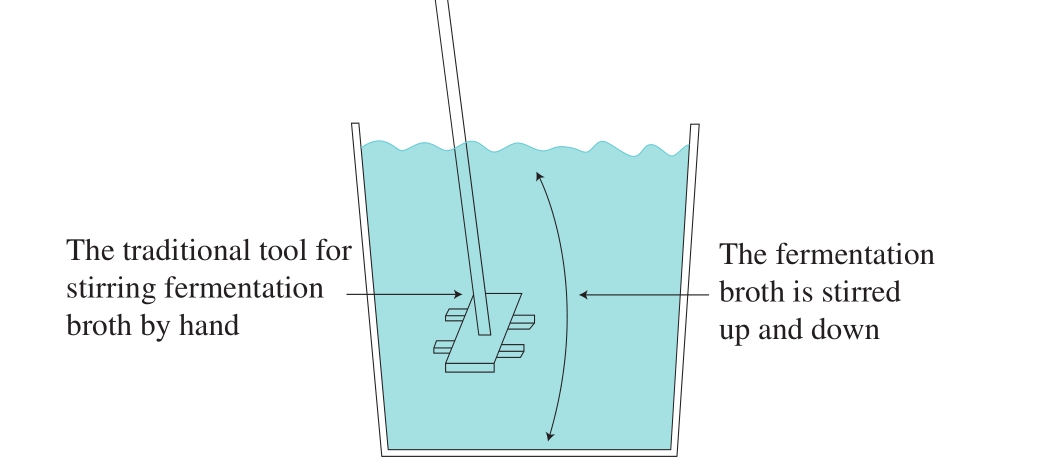
Fig. 2 Schematic diagram of manual stirring of fermentation broth

Fig. 3 Schematic diagram of producing rosy vinegar by pneumatic stirring method
Table 1 Experimental design of rosy vinegar fermentation
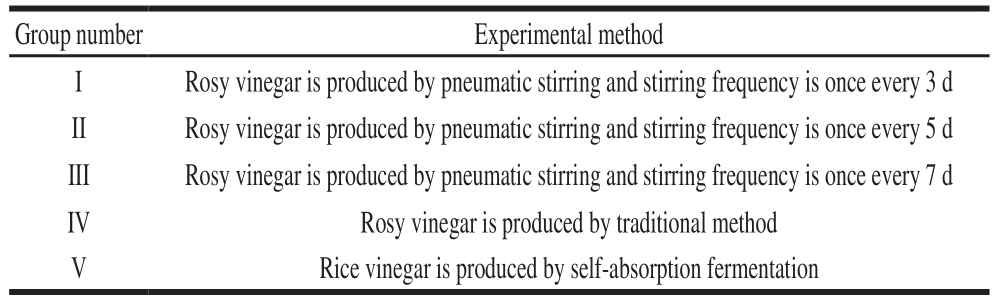
Note: Group V. Rice is fermented into wine mash after soaking and boiling.Adjust the alcohol content of the fermented wine mash was adjusted to 7%(V/V). The acetic acid bacteria with the mentioned fraction of 5% were added and fermented in a 2 t self-priming fermenter. The fermentation temperature was set at 32 ℃ and the fermentation time was 4 d. After fermentation, the total acid content of vinegar was 6 g/100 mL.
Group number Experimental method I Rosy vinegar is produced by pneumatic stirring and stirring frequency is once every 3 d II Rosy vinegar is produced by pneumatic stirring and stirring frequency is once every 5 d III Rosy vinegar is produced by pneumatic stirring and stirring frequency is once every 7 d IV Rosy vinegar is produced by traditional method V Rice vinegar is produced by self-absorption fermentation
1.4.1 Analytical methods of the chemical indexes
The dinitrosalicylic acid method[9] was used to determine the reducing sugar in the vinegar samples. Total acidity (in terms of acetic acid) was measured by adding 10 mL of vinegar sample to 50 mL of deionized water and titrating with 0.1 mol/L sodium hydroxide until an end point of pH 8.2 was reached (GB/T 5517-2010, China)[10]. Distillation method was used to quantify the content of ethanol (GB/T 13662-2008,China)[11].
1.4.2 Determination of organic acid by high performance liquid chromatography (HPLC)
2 mL of sample was loaded into 2 mL centrifuge tube and centrifuged for 1 min at 10 000 r/min to remove impurities. Then filter with a 0.22 μm micron filter membrane. HPLC chromatography analysis conditions:chromatographic column: Inertsil ODS-3 (4.6 mm ×250 mm, 5 μm); mobile phase: 5% methyl alcohol-95% 6 g/L ammonium dihydrogen phosphate (pH 2.60); flow rate:0.8 mL/min; injection volume: 5 μL; column temperature:30 ℃; detector: UV, detected wave length: 210 nm.
1.4.3 Volatile compound analysis
Solid-phase microextraction (SPME): put 5.00 mL of samples accurately, 2 μL of 0.1 g/L 3-octanol (internal standard substance), and 2.0 g NaCl in extraction bottles, and then keep them in 50 ℃ water bath for 10 min. The extraction temperature was 50 ℃, and the headspace absorption time was 40 min.
Gas chromatography (GC) conditions: chromatographic column: DB-1701 capillary chromatographic column(30 mm × 0.25 mm, 0.25 μm). Temperature rise procedure:initial temperature was 40 ℃; maintained for 10 min;increased to 100 ℃ at a rate of 3 ℃/min, and then increased to 180 ℃ at a rate of 4 ℃/min; next, increased to 220 ℃ at a rate of 6 ℃/min. Sample injection method: splitless sampling;carrier gas: helium (the flow rate was 1.0 mL/min); injection port temperature was 250 ℃.
Mass spectrometer (MS) conditions: ionization method:EI (electron energy is 70 eV); ion source temperature:230 ℃; MS interface temperature: 220 ℃; and scanning quality range: 33-450 u.
Analysis method: Xcalibur software was used to collect data by reference to NIST 05 base; The material composition was preliminarily identified via a library; combined retention time, mass spectrometry, reagent composition and retentionindex qualitative method. Carry out relative quantification with area normalization method.
Quantitative method: 3-octanol was selected as internal standard substance; measure the corresponding response factors of acetic acid, 3-methyl butyraldehyde, butanol and ethyl acetate relative to 3-octano were mesured. The carbonyl compound and heterocyclic compounds were calculated as per response factor of aldehydes.
Calculation of relative mass correction factor:
Where: As and Ai refer to the peak area of standard substance i and internal standard substance s respectively; mi and ms refer to the content of standard substance i and internal standard substance s respectively.
Calculation equation for flavor substance content:
Where: Wi and Ws refer to the content of component i and internal standard substances, respectively; Ai and As refer to the peak areas of component i and internal standard substance s respectively; Fi refers to the relative mass correction factor of each substance.
The determination results of volatile components were analyzed by principal component analysis (PCA).
1.4.4 Sensory analysis
Sensory evaluation of the vinegar was conducted by a panel of 10 judges (5 males and 5 females) with rich experiences on wine descriptive analysis. There was a uniform source of lightening, absence of nois Calculatee and distracting stimuli. 15 mL samples were presented in clear,tulip-shaped glasses marked with a random order and covered with petri dishes. A total of 9 descriptors of appearance (color and turbidity), aroma (ester, burnt and vinegar), taste/f l avor(sweet, sour and umami) and mouth-feel (astringency) were selected by the panel during preliminary training sessions to describe the samples. Intensity ratings were scored on a scale from 0 to 10 (0: none; 1-2: very weak; 3-4: ordinary; 5-6:moderate; 7-8: strong; 9-10: very strong)[12].
In order to explore the optimum ventilation time and airflow rate of each pneumatic stirring, the content of total acids of rosy vinegar fermentation for 1 month was investigated at different airflow rates and ventilation times.The content of total acids of rosy vinegar fermented 30 d was increased at beginning and then decreased with the increase of airflow rates and ventilation time (showed in Fig. 4 and Fig. 5). Low airflow rates or ventilation time will lead to uneven mixing of materials and slow down the fermentation of rosy vinegar. High airf l ow rates or ventilation time will increase the volatilization of acetic acid in rosy vinegar.According to Fig. 4 and Fig. 5, the airflow rates of 0.5-0.9 m3/min and the ventilation time of 40-60 s were selected for the factorial experiment. The results were shown in Fig. 6. The resulting regression model, in terms of code factors, was predicted by Eq. (3).
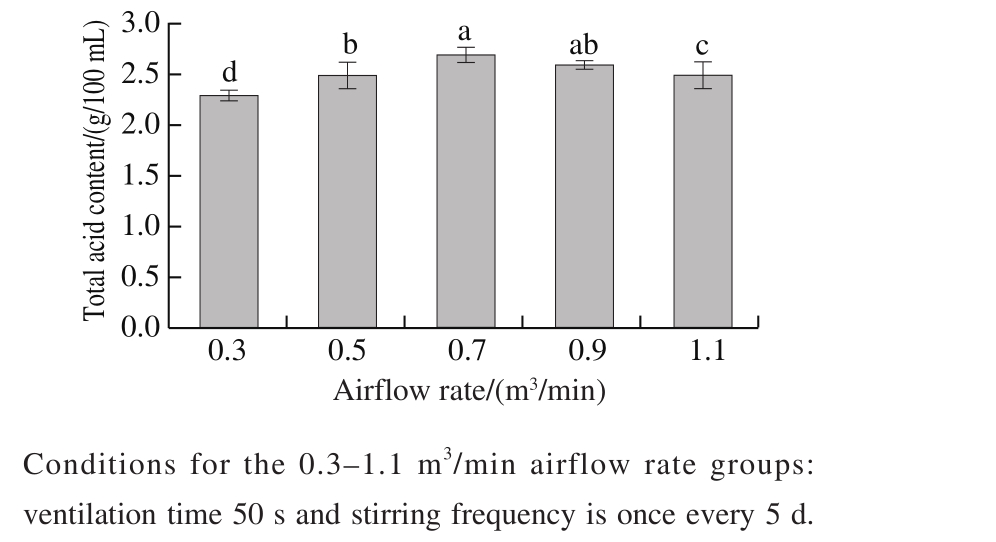
Fig. 4 Effect of airf l ow rate of pneumatic stirring on the fermentation of rosy vinegar

Fig. 5 Effects of ventilation time of pneumatic stirring on the fermentation of rosy vinegar
According to the results from factorial experiment,the regression coefficient (R2=0.936 0) demonstrated that the obtained second-order polynomial model was adequate and significant. Based on the quadratic model, the optimal theoretical value ventilation time and airflow rate were determined to be 53 s and 0.73 m3/min, respectively.
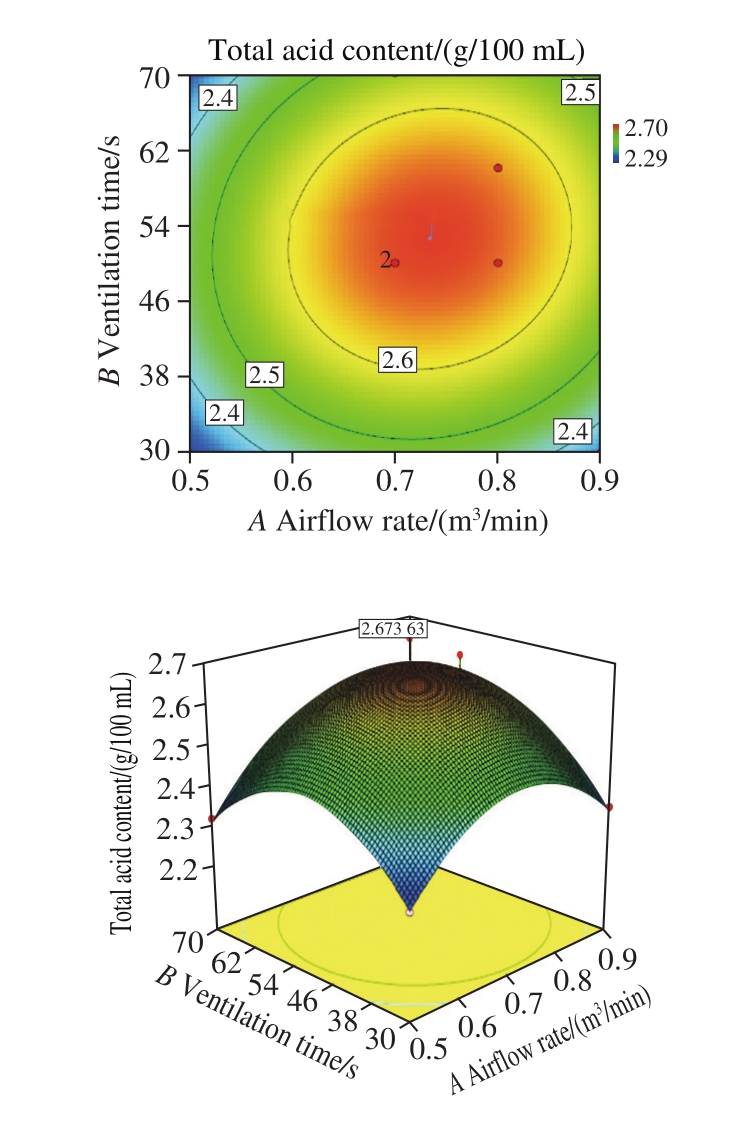
Fig. 6 The results of factorial experiment
According to the observation of bacterial membrane on the fermentation broth surface after stirring of vinegar mash,the bacterial membrane on the surface 2-7 d after traditional manual stirring and pneumatic stirring of vinegar mash is shown in the following Fig. 7 and Fig. 8.
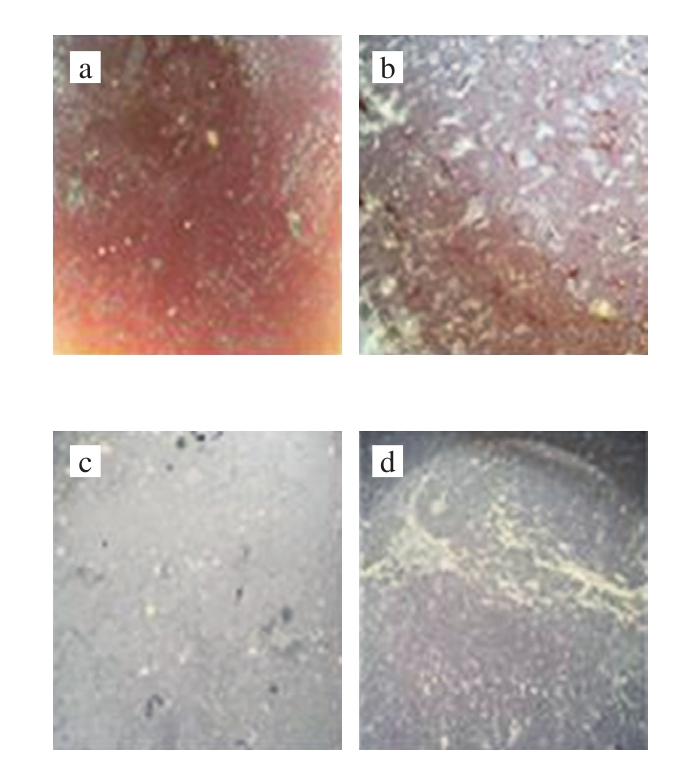

Fig. 7 Changes of bacterial membrane on fermentation broth stirred by traditional method for 2-7 d
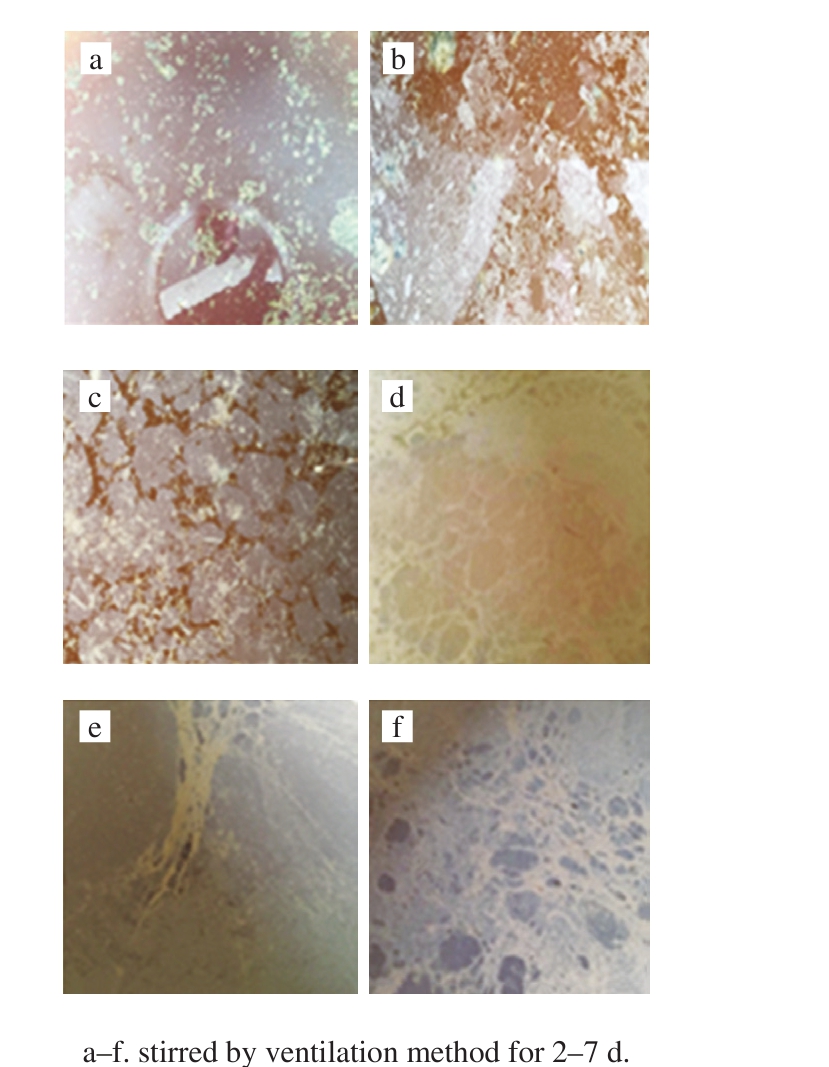
Fig. 8 Changes of bacterial membrane on fermentation broth stirred by ventilation method for 2-7 d
It can be seen in Fig. 7 and Fig. 8 that the surface of the fermentation liquid will form a bacterial biofilm during the fermentation of rosy vinegar, and there is no significant difference in the formation of bacterial membranes after stirring vinegar mash by two stirring methods. The fermentation of Zhejiang rosy vinegar is a static surface fermentation process, where the bacterial membrane on the surface plays a leading role in acetic fermentation of rosy vinegar. It can be seen from Fig. 7a and Fig. 8a that there were few bacterial membranes in the next day of stirring,for the bacterial membrane on the surface was damaged by the stirring action. After stirring, the bacterial biofilm would become thicker with time. A large number of studies have shown that the bacterial biofilm is bacterial cellulose produced by acetic bacteria[13-16]. In the static surface fermentation process, the polysaccharide biofilm produced by acetic bacterial causes aggregation between cells and improve the bacterial ability to adapt to the environment[17]. In addition,the bacterial biofilm will float acetic bacteria on the surface of fermentation liquid, proving breathing space for acetic bacteria and facilitating the process of acetic acid fermentation[18]. Over time, excessive cellulose is produced around the acetic bacterial cells, which will hinder the material exchange between acetic bacteria and air and culture matrix.
Table 2 Number of acetic bacteria andSaccharomyces in Zhejiang rosy vinegar during fermentation
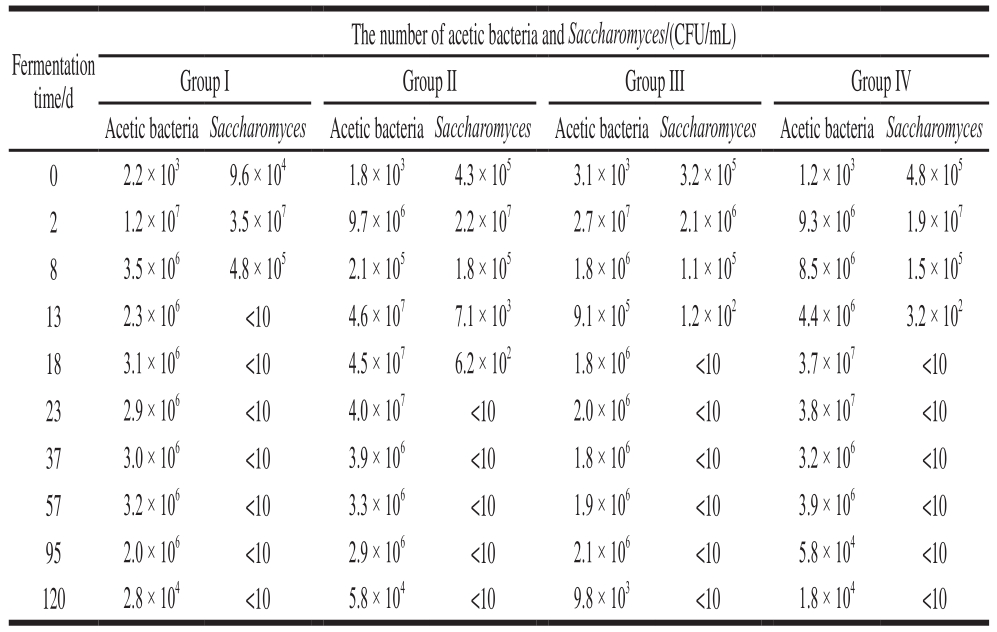
Note: group I, group II, and group III.The rosy vinegar produced by pneumatic stirring, and the frequency of stirring was once every 3, 5 and 7 d;Group IV. Produced by traditional methods (stirred by hand); and Group V.Self-aspirating fermented rice vinegar.
The number of acetic bacteria and Saccharomyces/(CFU/mL)Group I Group II Group III Group IV Acetic bacteria Saccharomyces Acetic bacteria Saccharomyces Acetic bacteria Saccharomyces Acetic bacteria Saccharomyces 0 2.2 × 10³ 9.6 × 10⁴ 1.8 × 10³ 4.3 × 10⁵ 3.1 × 10³ 3.2 × 10⁵ 1.2 × 10³ 4.8 × 10⁵ 2 1.2 × 10⁷ 3.5 × 10⁷ 9.7 × 10⁶ 2.2 × 10⁷ 2.7 × 10⁷ 2.1 × 10⁶ 9.3 × 10⁶ 1.9 × 10⁷ 8 3.5 × 10⁶ 4.8 × 10⁵ 2.1 × 10⁵ 1.8 × 10⁵ 1.8 × 10⁶ 1.1 × 10⁵ 8.5 × 10⁶ 1.5 × 10⁵ 13 2.3 × 10⁶ <10 4.6 × 10⁷ 7.1 × 10³ 9.1 × 10⁵ 1.2 × 10² 4.4 × 10⁶ 3.2 × 10² 18 3.1 × 10⁶ <10 4.5 × 10⁷ 6.2 × 10² 1.8 × 10⁶ <10 3.7 × 10⁷ <10 23 2.9 × 10⁶ <10 4.0 × 10⁷ <10 2.0 × 10⁶ <10 3.8 × 10⁷ <10 37 3.0 × 10⁶ <10 3.9 × 10⁶ <10 1.8 × 10⁶ <10 3.2 × 10⁶ <10 57 3.2 × 10⁶ <10 3.3 × 10⁶ <10 1.9 × 10⁶ <10 3.9 × 10⁶ <10 95 2.0 × 10⁶ <10 2.9 × 10⁶ <10 2.1 × 10⁶ <10 5.8 × 10⁴ <10 120 2.8 × 10⁴ <10 5.8 × 10⁴ <10 9.8 × 10³ <10 1.8 × 10⁴ <10 Fermentation time/d
It can be seen from Table 2 that the contents of acetic acid bacteria in group I and group III were significantly lower than those in group II and group IV. This was because the excessive stirring frequency in group I caused continuous damage to the bacterial membrane, which was not conducive to the growth of acetic bacteria. The mixing frequency of the group III was too low, which would lead to the formation of too many bacterial membranes, which would hinder the material exchange and the growth of acetic bacteria. Because the membrane has an important effect on the growth of acetic bacteria, it also has a crucial effect on the fermentation speed and sensory index of rosy vinegar. As can be seen from Fig. 9, the fermentation speeds of group II and group IV were significantly higher than those of group I and group III,because the appropriate amount of bacterial membrane was conducive to the fermentation. The appropriate amount of membrane is beneficial to microbial metabolism. Therefore,the sensory indexes of rosy vinegar in group II and group IV were significantly higher than those in group I and group IV.Because the stirring frequency has a great influence on the membrane, the fermentation speed and quality of Zhejiang rosy vinegar.
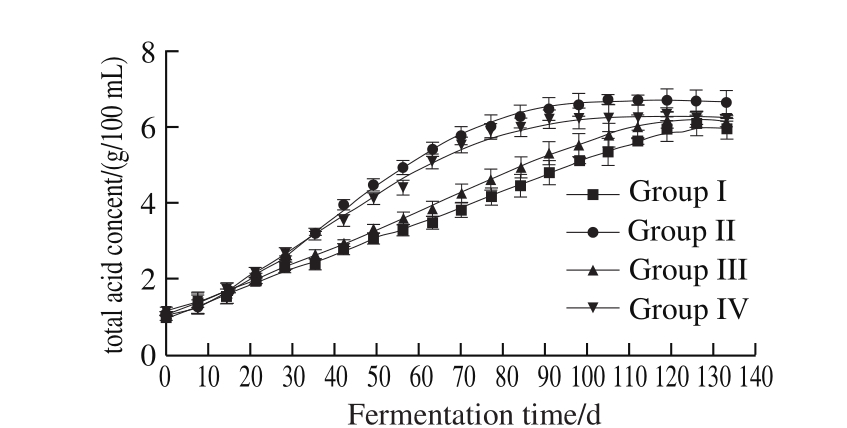
Fig. 9 Evolution of total acid concentration during fermentation
In order to explore the effects of pneumatic stirring and its stirring frequency on the fermentation process of Zhejiang rosy vinegar, in this research we took the rosy vinegar (Group IV) made with traditional methods as the control group, the changes in physicochemical indexes and microbe quantity during the fermentation process were tracked and measured;the results are shown in Table 2 and Fig. 9-Fig. 11.

Fig. 10 Evolution of reducing sugar concentrationt during fermentation

Fig. 11 Evolution of alcohol concentration during fermentation
According to the results, during the fermentation process, different stirring methods and different stirring frequencies of rosy vinegar have certain effect on the microbial quantity and changes in physicochemical indexes during the fermentation process of rosy vinegar. It can be seen from Table 2 that when the pneumatic stirring method was used, different stirring frequencies had a certain effect on the quantity ofSaccharomyces and acetic acid bacteria in rosy vinegar. During the fermentation processes of rosy vinegar with stirring frequencies of every 3 d (Group I)and every 7 d (Group III), the quantity of acetic acid bacteria is significantly lower than that in rosy vinegar stirred every 5 d (Group II). This is due to the excessively high stirring frequency, which will continuously damage bacteria membrane, while excessively low stirring frequency will cause the generation of bacterial cellulose, which will hinder the material exchange between acetic bacteria and air and culture matrix, both of which will affect the growth of acetic acid bacteria. This is consistent with the growth trend of total acid content in Fig. 9; the growth rate of total acid content in Group II is obviously higher than those in Group I and Group III. In Group II, the stirring frequency is the same as the vinegar mash stirring frequency of traditional rosy vinegar(Group IV), but the stirring method is different; during the fermentation process, the content of acetic acid bacteria in vinegar mash of Group II is slightly higher than that of Group IV, so is the growth rate of total acid; this might be the result of lower damage to acetic acid bacteria, since the ventilation method is adopted in Group II for stirring of vinegar mash.
The growth rate ofSaccharomyces in Group I is the highest one, this is because that during the alcoholic fermentation process, a higher stirring frequency is used to bring a moderate amount of oxygen into the fermentation broth, to discharge the heat produced by carbon dioxide and biochemical action, and to mix materials equally,which is beneficial to multiplication ofSaccharomyces.However, excessively quick alcoholic fermentation will cause excessively rapid rise of alcoholic content, which may restrainSaccharomyces; at the same time, starch is turned into sugar to continue; therefore, the residual reducing sugar content in Group I is the highest (Fig. 10), which leads to the lowest total acid content, affecting the final yield of rosy vinegar; excessively high stirring frequency will continuously damage the formation of acetic acid bacteria membrane, and excessively high alcohol content will restrain the generation of acetic acid bacteria, leading to hard rise of vinegar acidity and then putrefaction of vinegar. The stirring frequency in Group III is the lowest one, the multiplication speed ofSaccharomyces is the lowest one, and the alcoholic fermentation rate is relatively low. Therefore, when there was still a relatively large amount of reducing sugar, the growth of Saccharomyces was restrained due to the increase of alcohol content, and alcoholic fermentation stopped, affecting the fi nal yield of rosy vinegar too.
It can be seen from Fig. 11 that during 70-80 d, no ethyl alcohol can be detected in Group II and Group III and the rise speed of total acid content in this period slowed down obviously, but then continued to rise slowly. This is because that rosy vinegar fermentation is trilateral fermentation, and ethyl alcohol of a low content then continued to provide a small amount of ethyl alcohol for acetic fermentation, and the Gluconobacter in vinegar can directly oxidize glucose into gluconic acid, causing the total acid content to rise slowly(same principles apply in Group I and Group III). At the later stage of fermentation, the total acid content was decreased slightly, soAcetobacter can oxidize acetic acid and lactic acid into CO2 and water, reducing the acidity degree. The content of reducing sugar was increased slowly 10 dlater. This is because that the glucoamylase continued to play a role and theSaccharomyces activity was restrained due to the increase of acidity degree. But the content of reducing sugar showed a slight downward trend at the later stage of fermentation, this is due to the Maillard reaction between reducing sugars and amino acids,resulting in a reduction in content of reducing sugar[19].
After the fermentation, vinegar in each group was squeezed respectively, and the acquired vinegar was converted into standard vinegar of 4 g/100 mL, where the rosy vinegar yield of Group II is the highest; 1:6.13 (V/V)rosy vinegar (Group IV) produced by traditional method was increased to 1:6.65 (V/V), showing significant improvement.Therefore, in the production of rosy vinegar, the pneumatic stirring method of stirring every 5 d has a better result.
HPLC was used to measure the contents of characteristic organic acids in Group I, Group II, Group III, Group IV and Group V (liquid submerged-fermentation rice vinegar for comparison); the measurement results are shown in Table 3.
Table 3 Composition of various organic acids in 5 vinegar samples
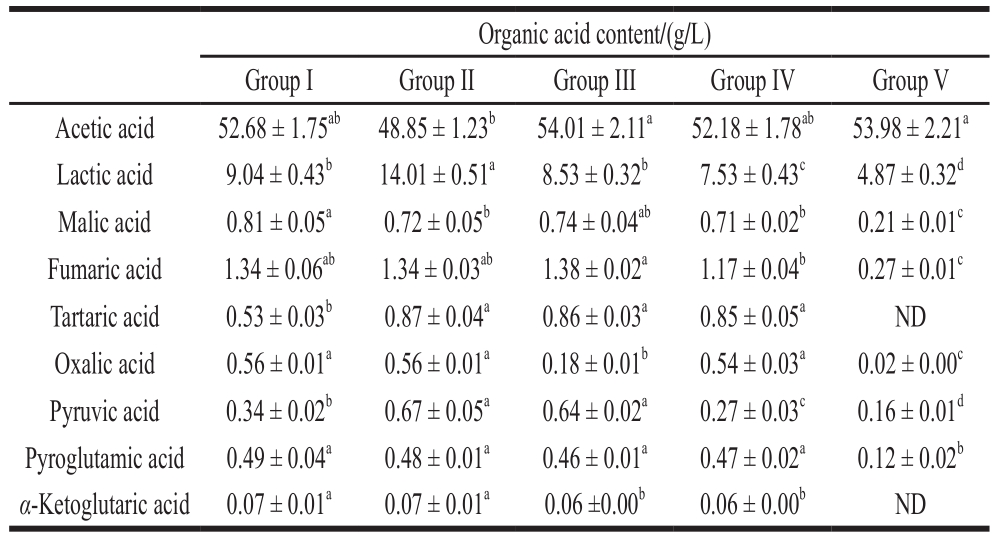
Note: The results are expressed as ±swith three replicates for each vinegar sample at the end of fermentation. Group I, group II and group III. The rosy vinegar produced by pneumatic stirring, and the frequency of stirring was once every 3, 5 and 7d; Group IV. Produced by traditional methods (stirred by hand); and Group V. Self-aspirating fermented rice vinegar. a-d. In rows with different letters indicate signi fi cant difference (P< 0.05). ND. Not de fi ned.
Organic acid content/(g/L)Group I Group II Group III Group IV Group V Acetic acid 52.68 ± 1.75ab 48.85 ± 1.23b 54.01 ± 2.11a 52.18 ± 1.78ab 53.98 ± 2.21a Lactic acid 9.04 ± 0.43b 14.01 ± 0.51a 8.53 ± 0.32b 7.53 ± 0.43c 4.87 ± 0.32d Malic acid 0.81 ± 0.05a 0.72 ± 0.05b 0.74 ± 0.04ab 0.71 ± 0.02b 0.21 ± 0.01c Fumaric acid 1.34 ± 0.06ab 1.34 ± 0.03ab 1.38 ± 0.02a 1.17 ± 0.04b 0.27 ± 0.01c Tartaric acid 0.53 ± 0.03b 0.87 ± 0.04a 0.86 ± 0.03a 0.85 ± 0.05a ND Oxalic acid 0.56 ± 0.01a 0.56 ± 0.01a 0.18 ± 0.01b 0.54 ± 0.03a 0.02 ± 0.00c Pyruvic acid 0.34 ± 0.02b 0.67 ± 0.05a 0.64 ± 0.02a 0.27 ± 0.03c 0.16 ± 0.01d Pyroglutamic acid 0.49 ± 0.04a 0.48 ± 0.01a 0.46 ± 0.01a 0.47 ± 0.02a 0.12 ± 0.02b α-Ketoglutaric acid 0.07 ± 0.01a 0.07 ± 0.01a 0.06 ±0.00b 0.06 ± 0.00b ND
Table 4 Concentrations of volatile flavor substances in 5 vinegar samples
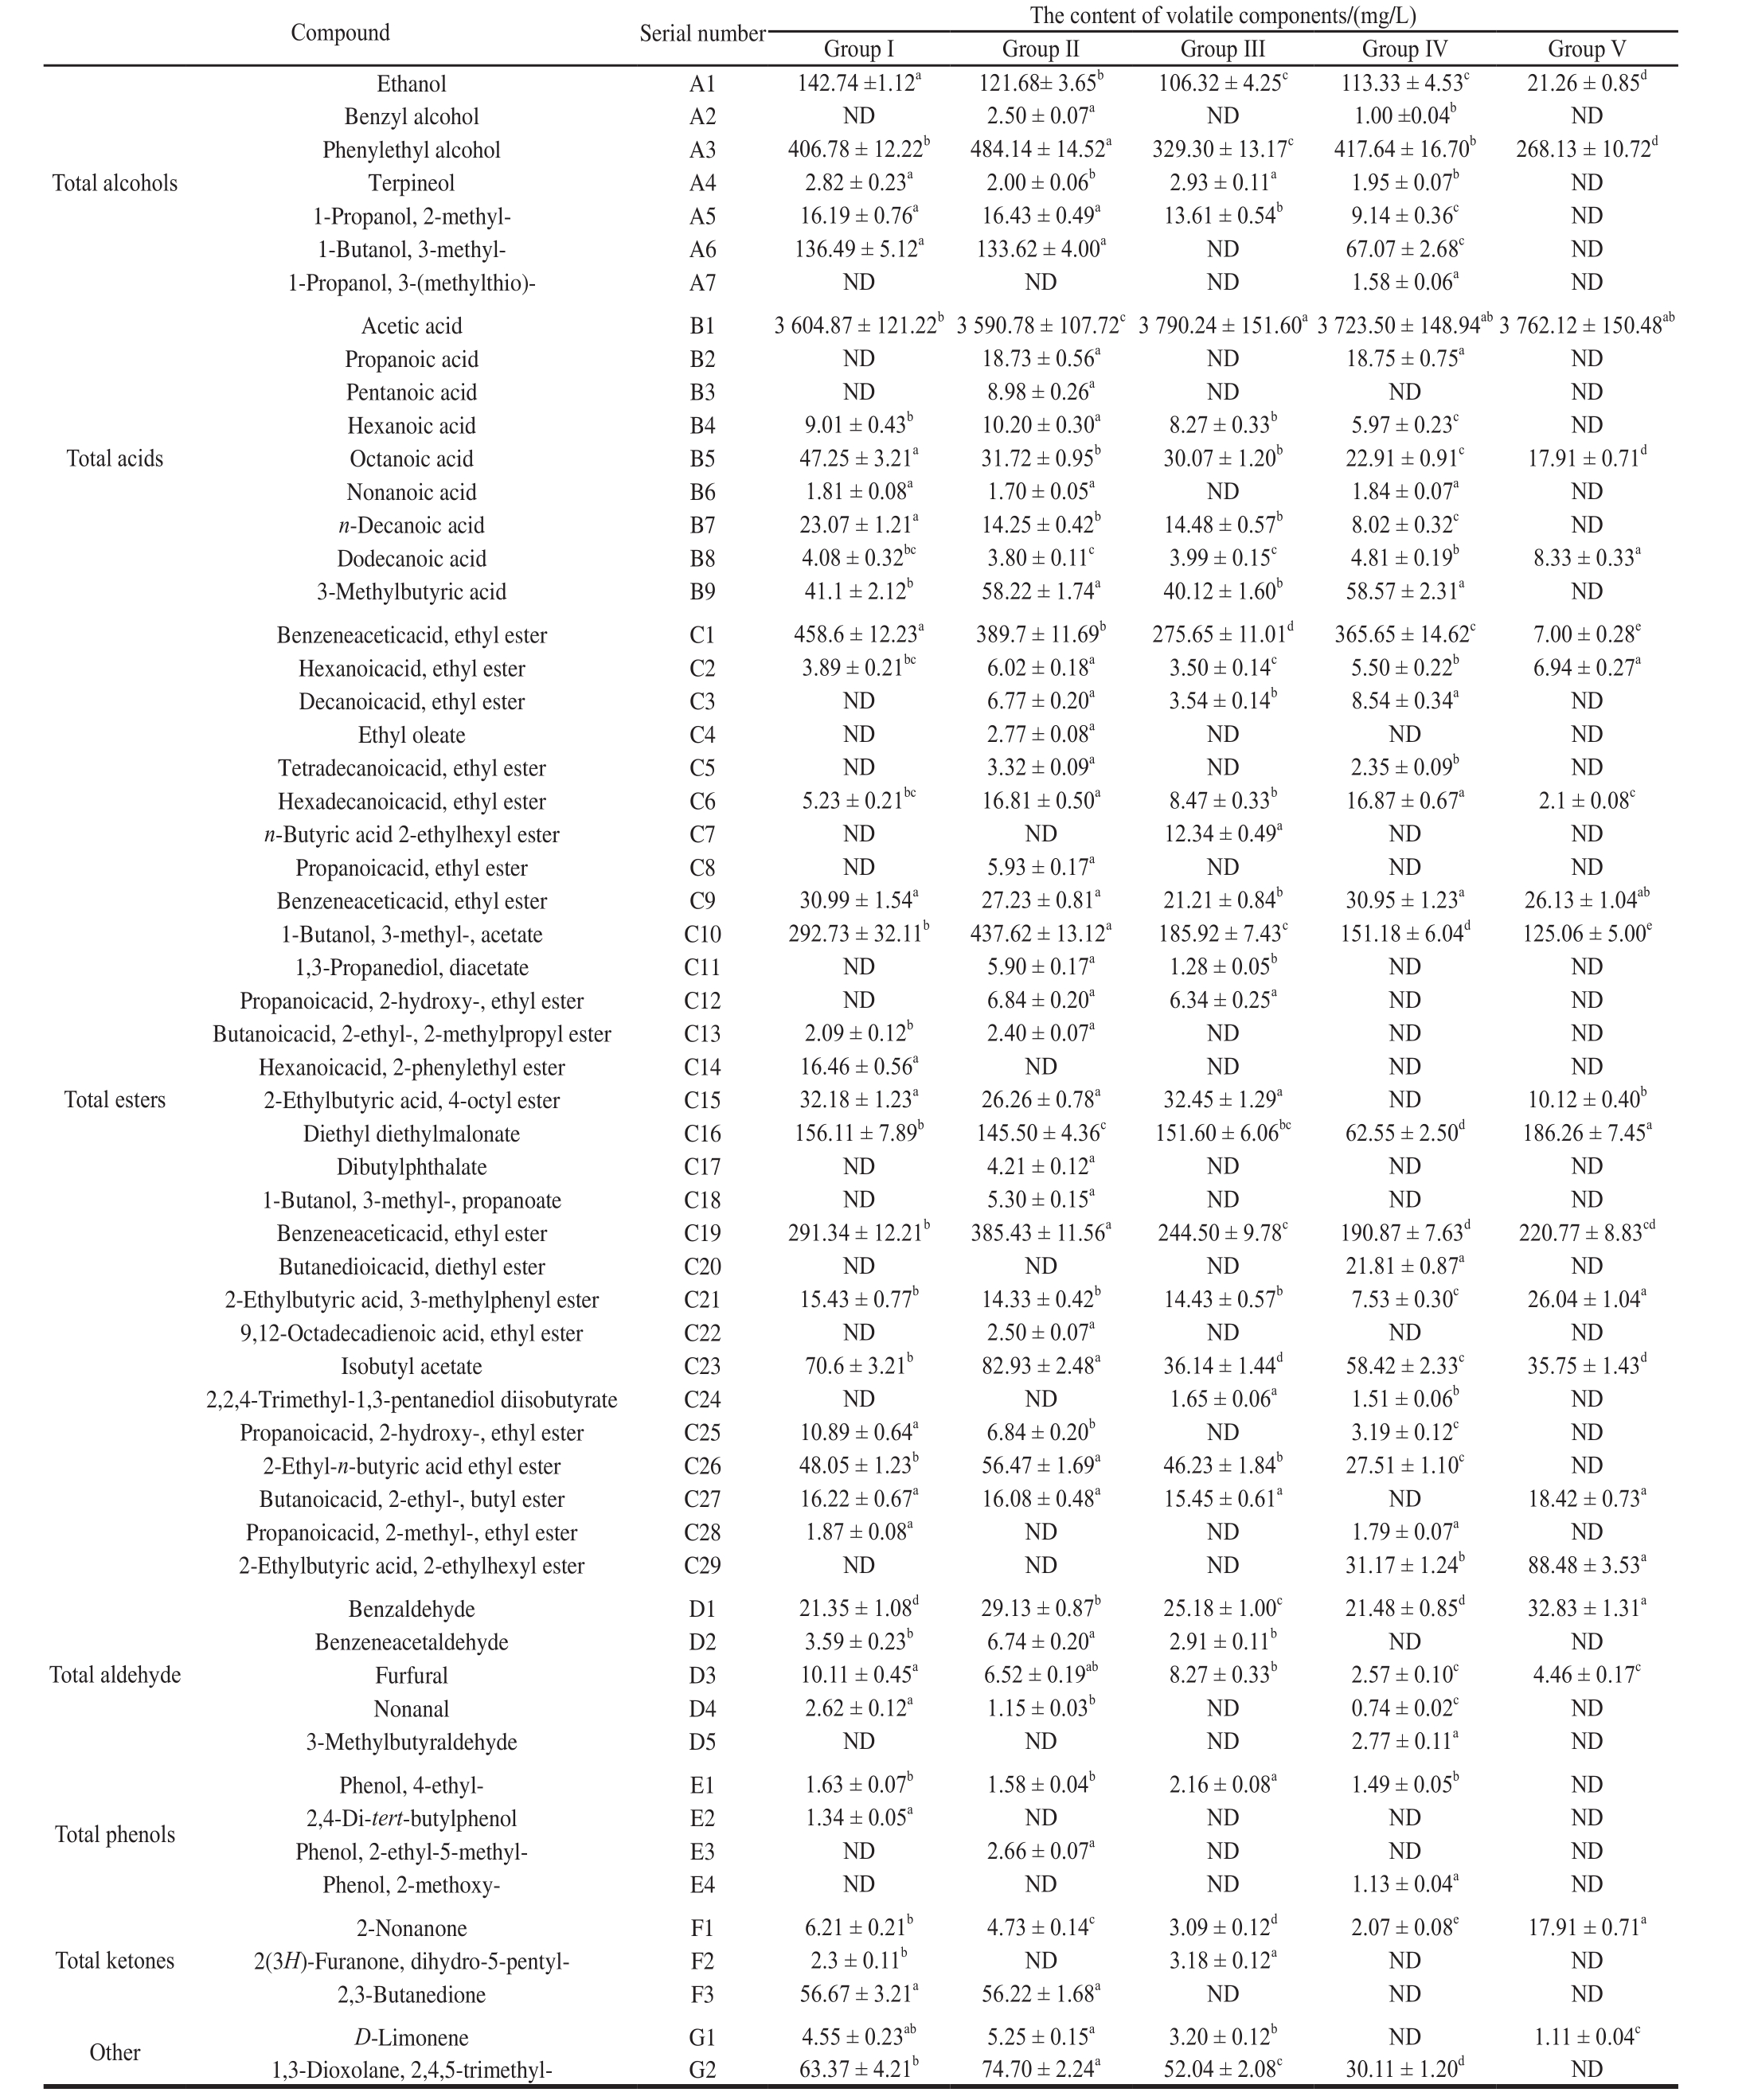
Note: The results are expressed as ± s with three replicates for each vinegar sample at the end of fermentation. Group I, group II and group III. The rosy vinegar produced by pneumatic stirring, and the frequency of stirring was once every 3, 5 d and 7 d; Group IV. Produced by traditional methods (stirred by hand); Group V.Self-aspirating fermented rice vinegar. a-e. In rows with different letters are signi fi cantly different (P< 0.05). ND. Not de fi ned.
Compound Serial number The content of volatile components/(mg/L)Group I Group II Group III Group IV Group V Total alcohols Ethanol A1 142.74 ±1.12a 121.68± 3.65b 106.32 ± 4.25c 113.33 ± 4.53c 21.26 ± 0.85d Benzyl alcohol A2 ND 2.50 ± 0.07a ND 1.00 ±0.04b ND Phenylethyl alcohol A3 406.78 ± 12.22b 484.14 ± 14.52a 329.30 ± 13.17c 417.64 ± 16.70b 268.13 ± 10.72d Terpineol A4 2.82 ± 0.23a 2.00 ± 0.06b 2.93 ± 0.11a 1.95 ± 0.07b ND 1-Propanol, 2-methyl- A5 16.19 ± 0.76a 16.43 ± 0.49a 13.61 ± 0.54b 9.14 ± 0.36c ND 1-Butanol, 3-methyl- A6 136.49 ± 5.12a 133.62 ± 4.00a ND 67.07 ± 2.68c ND 1-Propanol, 3-(methylthio)- A7 ND ND ND 1.58 ± 0.06a ND Total acids Total esters Total aldehyde Total phenols Acetic acid B1 3 604.87 ± 121.22b3 590.78 ± 107.72c3 790.24 ± 151.60a3 723.50 ± 148.94ab3 762.12 ± 150.48ab Propanoic acid B2 ND 18.73 ± 0.56a ND 18.75 ± 0.75a ND Pentanoic acid B3 ND 8.98 ± 0.26a ND ND ND Hexanoic acid B4 9.01 ± 0.43b 10.20 ± 0.30a 8.27 ± 0.33b 5.97 ± 0.23c ND Octanoic acid B5 47.25 ± 3.21a 31.72 ± 0.95b 30.07 ± 1.20b 22.91 ± 0.91c 17.91 ± 0.71d Nonanoic acid B6 1.81 ± 0.08a 1.70 ± 0.05a ND 1.84 ± 0.07a ND n-Decanoic acid B7 23.07 ± 1.21a 14.25 ± 0.42b 14.48 ± 0.57b 8.02 ± 0.32c ND Dodecanoic acid B8 4.08 ± 0.32bc 3.80 ± 0.11c 3.99 ± 0.15c 4.81 ± 0.19b 8.33 ± 0.33a 3-Methylbutyric acid B9 41.1 ± 2.12b 58.22 ± 1.74a 40.12 ± 1.60b 58.57 ± 2.31a ND Benzeneaceticacid, ethyl ester C1 458.6 ± 12.23a 389.7 ± 11.69b 275.65 ± 11.01d 365.65 ± 14.62c 7.00 ± 0.28e Hexanoicacid, ethyl ester C2 3.89 ± 0.21bc 6.02 ± 0.18a 3.50 ± 0.14c 5.50 ± 0.22b 6.94 ± 0.27a Decanoicacid, ethyl ester C3 ND 6.77 ± 0.20a 3.54 ± 0.14b 8.54 ± 0.34a ND Ethyl oleate C4 ND 2.77 ± 0.08a ND ND ND Tetradecanoicacid, ethyl ester C5 ND 3.32 ± 0.09a ND 2.35 ± 0.09b ND Hexadecanoicacid, ethyl ester C6 5.23 ± 0.21bc 16.81 ± 0.50a 8.47 ± 0.33b 16.87 ± 0.67a 2.1 ± 0.08c n-Butyric acid 2-ethylhexyl ester C7 ND ND 12.34 ± 0.49a ND ND Propanoicacid, ethyl ester C8 ND 5.93 ± 0.17a ND ND ND Benzeneaceticacid, ethyl ester C9 30.99 ± 1.54a 27.23 ± 0.81a 21.21 ± 0.84b 30.95 ± 1.23a 26.13 ± 1.04ab 1-Butanol, 3-methyl-, acetate C10 292.73 ± 32.11b 437.62 ± 13.12a 185.92 ± 7.43c 151.18 ± 6.04d 125.06 ± 5.00e 1,3-Propanediol, diacetate C11 ND 5.90 ± 0.17a 1.28 ± 0.05b ND ND Propanoicacid, 2-hydroxy-, ethyl ester C12 ND 6.84 ± 0.20a 6.34 ± 0.25a ND ND Butanoicacid, 2-ethyl-, 2-methylpropyl ester C13 2.09 ± 0.12b 2.40 ± 0.07a ND ND ND Hexanoicacid, 2-phenylethyl ester C14 16.46 ± 0.56a ND ND ND ND 2-Ethylbutyric acid, 4-octyl ester C15 32.18 ± 1.23a 26.26 ± 0.78a 32.45 ± 1.29a ND 10.12 ± 0.40b Diethyl diethylmalonate C16 156.11 ± 7.89b 145.50 ± 4.36c 151.60 ± 6.06bc 62.55 ± 2.50d 186.26 ± 7.45a Dibutylphthalate C17 ND 4.21 ± 0.12a ND ND ND 1-Butanol, 3-methyl-, propanoate C18 ND 5.30 ± 0.15a ND ND ND Benzeneaceticacid, ethyl ester C19 291.34 ± 12.21b 385.43 ± 11.56a 244.50 ± 9.78c 190.87 ± 7.63d 220.77 ± 8.83cd Butanedioicacid, diethyl ester C20 ND ND ND 21.81 ± 0.87a ND 2-Ethylbutyric acid, 3-methylphenyl ester C21 15.43 ± 0.77b 14.33 ± 0.42b 14.43 ± 0.57b 7.53 ± 0.30c 26.04 ± 1.04a 9,12-Octadecadienoic acid, ethyl ester C22 ND 2.50 ± 0.07a ND ND ND Isobutyl acetate C23 70.6 ± 3.21b 82.93 ± 2.48a 36.14 ± 1.44d 58.42 ± 2.33c 35.75 ± 1.43d 2,2,4-Trimethyl-1,3-pentanediol diisobutyrate C24 ND ND 1.65 ± 0.06a 1.51 ± 0.06b ND Propanoicacid, 2-hydroxy-, ethyl ester C25 10.89 ± 0.64a 6.84 ± 0.20b ND 3.19 ± 0.12c ND 2-Ethyl-n-butyric acid ethyl ester C26 48.05 ± 1.23b 56.47 ± 1.69a 46.23 ± 1.84b 27.51 ± 1.10c ND Butanoicacid, 2-ethyl-, butyl ester C27 16.22 ± 0.67a 16.08 ± 0.48a 15.45 ± 0.61a ND 18.42 ± 0.73a Propanoicacid, 2-methyl-, ethyl ester C28 1.87 ± 0.08a ND ND 1.79 ± 0.07a ND 2-Ethylbutyric acid, 2-ethylhexyl ester C29 ND ND ND 31.17 ± 1.24b 88.48 ± 3.53a Benzaldehyde D1 21.35 ± 1.08d 29.13 ± 0.87b 25.18 ± 1.00c 21.48 ± 0.85d 32.83 ± 1.31a Benzeneacetaldehyde D2 3.59 ± 0.23b 6.74 ± 0.20a 2.91 ± 0.11b ND ND Furfural D3 10.11 ± 0.45a 6.52 ± 0.19ab 8.27 ± 0.33b 2.57 ± 0.10c 4.46 ± 0.17c Nonanal D4 2.62 ± 0.12a 1.15 ± 0.03b ND 0.74 ± 0.02c ND 3-Methylbutyraldehyde D5 ND ND ND 2.77 ± 0.11a ND Phenol, 4-ethyl- E1 1.63 ± 0.07b 1.58 ± 0.04b 2.16 ± 0.08a 1.49 ± 0.05b ND 2,4-Di-tert-butylphenol E2 1.34 ± 0.05a ND ND ND ND Phenol, 2-ethyl-5-methyl- E3 ND 2.66 ± 0.07a ND ND ND Phenol, 2-methoxy- E4 ND ND ND 1.13 ± 0.04a ND 2-Nonanone F1 6.21 ± 0.21b 4.73 ± 0.14c 3.09 ± 0.12d 2.07 ± 0.08e 17.91 ± 0.71a 2(3H)-Furanone, dihydro-5-pentyl- F2 2.3 ± 0.11b ND 3.18 ± 0.12a ND ND 2,3-Butanedione F3 56.67 ± 3.21a 56.22 ± 1.68a ND ND ND Other D-Limonene G1 4.55 ± 0.23ab 5.25 ± 0.15a 3.20 ± 0.12b ND 1.11 ± 0.04c 1,3-Dioxolane, 2,4,5-trimethyl- G2 63.37 ± 4.21b 74.70 ± 2.24a 52.04 ± 2.08c 30.11 ± 1.20d ND Total ketones
It can be seen from Table 3 that nine characteristic organic acids have been detected in all these 4 rosy vinegar samples; the total contents of characteristic acids in Group I, Group II, Group III, Group IV, Group V are 65.84, 67.57,66.87, 63.78, and 59.65 g/L, respectively. The proportion of acetic acid and lactic acid is the largest one among all rosy vinegar samples, accounting for about 90% of the total characteristic acids. The contents of the other 7 organic acids (oxalic acid, tartaric acid, malic acid, α-ketoglutaric acid, fumaric acid, pyroglutamic acid, and pyruvic acid) are relatively low; most of these organic acids are intermediate metabolites of tricarboxylic acid cycle pathway, which will also be used as the precursor of other metabolic pathways at the time of generation to enter more complicated metabolic pathways; therefore, there will be no large accumulation of them during the acetic fermentation process. But they are of a great importance to the taste and flavor of vinegar. The contents of nonvolatile acids: Group II (18.72 mg/mL) >Group I (13.17 mg/mL) > Group III (12.86 mg/mL) > Group IV (11.60 mg/mL) > Group V (5.67 mg/mL). Acetic acid is the main source of the sour taste of vinegar; ethanoic acid alone is too stimulating, with a short aftertaste. The increase in nonvolatile acid content is important to the enrichment of vinegar flavor; malic acid has fruity and lasting sour; fumaric acid has delicate flavor; malic acid, citric acid, and fumaric acid can buffer the irritation of acetic acidand increase the sour gentleness of vinegar[20].
In conclusion, the organic acid content in rosy vinegar samples is significantly higher than that in liquid submergedfermentation rice vinegar. In respect of organic acid composition, the acetic acid content in rosy vinegar samples is about the same as that in liquid submerged-fermentation rice vinegar, but the content of nonvolatile acids in the former is significantly higher than that in the later, this is one of the reasons that the flavor of rosy vinegar is better than that of liquid submerged-fermentation rice vinegar. The organic acid content and composition in rosy samples of Group II are the best. Therefore, the Group II method (use the ventilation method to stir vinegar mash every 5 d) can be used to replace traditional rosy vinegar production methods.
Volatile flavor components in Group I, Group II, Group III, Group IV, and Group V were measured; the measurement results of the 5 groups of vinegar samples were compared;besides, PCA was carried out on the content of volatile components in the 5 vinegar sample groups; the measurement results are shown in Table 4.
GC-MS was used to detect volatile flavor components in samples, and the contents of volatile flavor components were found to be as follows (Fig. 12), Group II (6 344.59 mg/L) >Group I (6 062.63 mg/L) > Group IV (5 505.83 mg/L) >Group III (5 500.06 mg/L) > Group V (4 887.13 mg/L); the number of types of volatile components detected: Group II (48) >Group IV (40) > Group I (39) > Group III (35) > Group V (20).
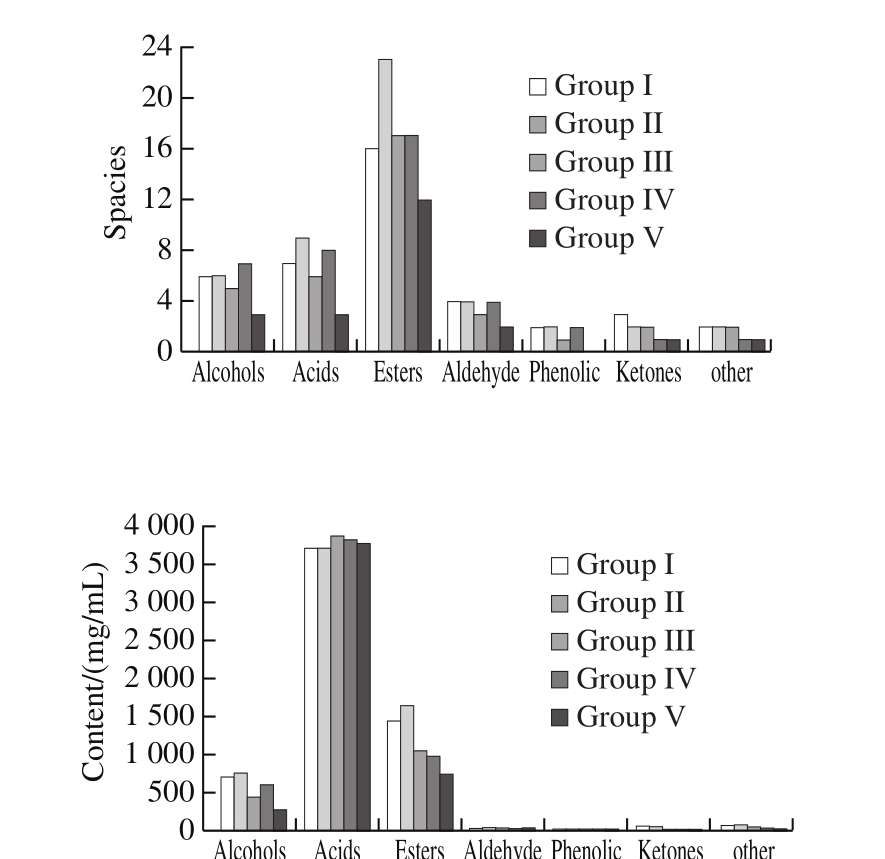
Fig. 12 Concentrations and kinds of volatile components in Zhejiang rosy vinegar samples
Alcohol: Among the 5 vinegar samples, 7 alcohols in total were detected. Main alcohols are: ethanol, phenylethyl alcohol, and 3-methyl-1-butanol. These alcohols are important contributors to the flavor of aromatic vinegar[21]. Phenylethyl alcohol is a reduction product of aldehyde generated from Strecker degradation of phenylalanine under the action of yeast[22], and currently this kind of compound is identified to be the main aromatic compound in liquor[23]. The phenylethyl alcohol content in Group II is as high as 484.14 mg/L, which is significantly higher than those of other vinegar samples.The 3-methyl-1-butanol contents in Group I and Group II are almost the same, which are twice of that in Group IV; no 3-methyl-1-butanol was found in Group III.
Acid: As shown in Fig. 12, acid substances are the components with the largest volatility in the 5 vinegar samples, and the difference in total number of acid substances in the 5 vinegar samples is not big. In acid substances,the content of 3-methylbutyric acid is the highest in rosy vinegar samples, only next to acetic acid. The contents of 3-methylbutyric acid in Group II and Group IV samples are basically the same; the contents in Group I and Group III are significantly lower than those of Group II and Group IV; no 3-methylbutyric acid was detected in Group V. The stirring frequencies of Group II and Group IV are the same, indicating that the stirring frequency may influence the content of 3-methylbutyric acid. 3-Methylbutyric acid is generated fromthe microbial degradation of branched-chain amino acid, L-leucine,which is taken as precursor. It is deemed to be a metabolic byproduct of yeast protein. 3-Methylbutyric acid, a combination of milk aroma, sour aroma, fruit aroma, and fat aroma, can give rosy vinegar a good flavor[24].
Ester: As shown in Fig. 12, among volatile components in all samples, esters have the largest amount. In Group II,24 esters were detected, obviously higher than those of other samples. Ethyl acetate, 1-butanol, 3-methyl-, acetate and benzeneacetic acid, ethyl ester are main ester compounds detected in rosy vinegar. Research have shown that the above three esters are the main ester substances that statically indicate the fermented vinegar. As shown in Table 4, contents of ethyl acetate in Group I, Group II, and Group III are 458.60, 389.70, and 275.65 mg/L respectively, decreasing with the reduction of stirring frequency; the content of ethyl acetate in Group IV is 365.65 mg/L, which is basically the same as Group II, and the stirring frequency of the two groups is the same, which indicates that the content of ethyl acetate may be related to the stirring frequency, with little relation to stirring methods. Both the contents of 1-butanol,3-methyl-, acetate and benzeneacetic acid, ethyl ester in Group I, Group II, and Group III are significantly higher than Group IV, and there are also an obvious differences in Group I, Group II, and Group III; in addition, the content in Group II is greatly higher than those in other samples,indicating that these two substances may be related to both the mixing frequency and mixing method. There are two main formation ways of ester compounds: 1) generated from the condensation of acid compounds and corresponding alcohol compounds under the catalytic action of esterase; 2)generated from the condensation of acetyl coenzyme A and corresponding alcohol compounds under the action of alcohol acyltransferase. Most esters have the aroma of flowers and fruits, and therefore can give rosy vinegar a good flavor[25-26].
Aldehyde, phenol, ketone, and other compounds: the dominant aldehyde in rosy vinegar is benzaldehyde which has sweet taste, fruit taste, and the taste of nut and caramel,and therefore can give vinegar samples a good aroma. It can be seen from Fig. 12 that the content of phenolic substances is the lowest in all aroma components, but they have a low odor threshold, and therefore they can provide a unique aroma for vinegar. Alkane substances may come from the ingredient itself; in other cases, the condensation reaction between aldehydes and alcohols may generate some alkane substances[27-29].
As shown by Table 4, the contents of volatile components in vinegar samples produced with different stirring methods and stirring frequencies are significantly different. PCA was carried out based on the contents of volatile components in samples, as shown in Fig. 13. The contribution rates of PC1, PC2, and PC3 are 43.29%, 22.88%,and 20.94%, respectively; the accumulative contribution rate is 87.12% (higher than 85.00%), which can basically ref l ect all the information of samples.

Fig. 13 Loading plot and score plot of principal component analysis
After separating standardization of the load of all components and sample score, a double fi gure for principal component load and vinegar sample score in PCA was made, as shown in Fig. 13. It can be seen that volatile flavor components in vinegar samples made with different stirring methods are significantly different. Rosy vinegar samples(Group I, Group II, and Group III) made with pneumatic stirring method have a similar flavor, and therefore can be divided into one category; but they are relatively different from rosy vinegar (Group IV) made with traditional manual production methods and liquid submerged-fermentation rice vinegar (Group V). Pneumatic stirring with different stirring frequencies also have certain effect on the volatile components in rosy vinegars[30-33].
The variance contribution rates α1, α2, and α3 of different characteristic values of 59 flavor substances in respect of three principal components, which are PC1, PC2, and PC3 and taken as weight coefficients; the comprehensive evaluation function F=α1PC1+α2PC2+α3PC3 was used to calculate the scores of 5 vinegar samples, and the aroma of vinegar samples was also evaluated. The evaluation model F=0.43PC1+0.23PC2+0.21PC3 of 5 vinegar samples was obtained based on principal component analysis. The score of each principal component in the 5 vinegar samples and the comprehensive scores thus calculated are shown in Table 5.Comprehensive scores: F (Group II) = 3.37 > F (Group IV) =1.03 > F (Group I) = -0.12 > F (Group III) = -1.25 > F(Group V) = -3.03.
A quantitative description analysis was carried on the indicators of four groups of finished rosy vinegar based on sensory evaluation rules for rice vinegar, in order to express the sensory results of all vinegar groups more clearly. Based on the sensory quantitative analysis results of the 5 vinegar groups, a radar graph was made, as shown in Fig. 14.
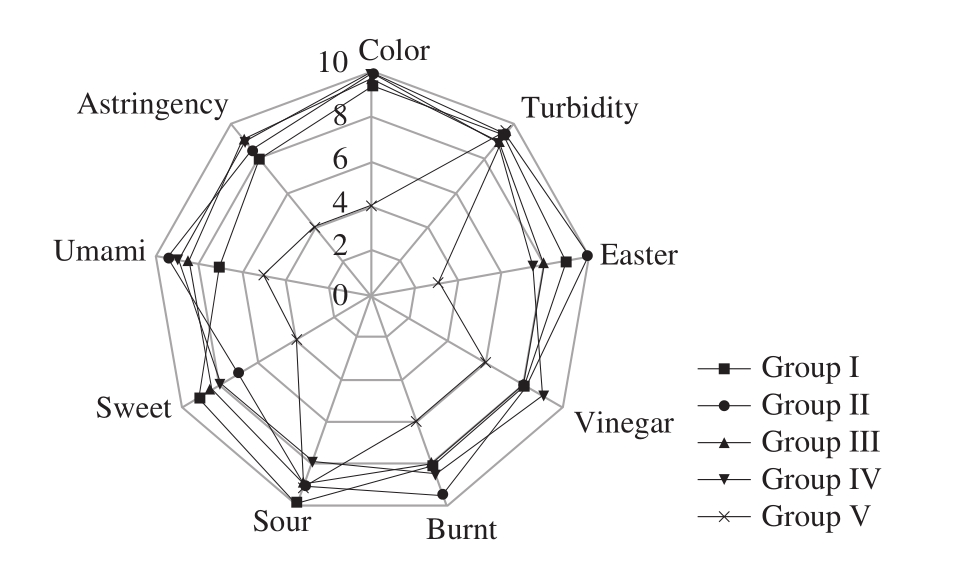
Fig. 14 Results of sensory evaluation for 5 vinegar samples
Sensory evaluation rules are: when a certain indicator is in its best condition, give full mark; based on the graphic area formed by the radar graph, quantitative description can be conducted for comprehensive sensory evaluation results of vinegar; the larger the area is, the better the sensory performance will be. As shown in Fig. 14, the turbidity and color of rosy vinegar are basically similar, namely,the clear and transparentrosy red; but there are significant differences in ester and sweet taste. Ester scores are as follows respectively: Group II (9.83 ± 0.21) > Group I(8.91 ± 0.58) > Group III (8.12 ± 0.78) > Group IV (7.61 ±0.56) > Group V (3.12 ± 0.76), which are consistent with the content of esters in part 3.5 of the paper. Sweet scores are as follows respectively: Group I (9.12 ± 0.56) > Group III (8.62 ±0.43) > Group IV (7.91 ± 0.97) > Group II (6.98 ± 0.67) >Group V (3.89 ± 0.87), which are consistent with the content of reducing sugar in part 2.5 of the paper. The areas of Group I, Group II, Group III, Group IV, Group V are 217.26, 233.57,215.93, 220.23, 97.70 respectively, namely Group II > Group IV > Group I > Group III > Group V. In respect of sensory indicators, it is feasible to replace traditional pure handmade process for rosy vinegar with Group II method.
Through the designing of different stirring methods for researching the effect of different stirring methods and stirring frequencies on microflora, physicochemical indexes, and flavor substances during the fermentation process of rosy vinegar and on sensation, results showed that, the optimal airflow rate and ventilation time of each stirring were determined to be 0.73 m3/min and 53 s. Too low stirring frequency can lead to excessive production of bacterial cellulose, which can affect the substance exchange of acetic bacteria. Pretty high stirring frequency will cause continuous damage to the bacterial biofilm, and is not conducive to the growth of acetic bacteria. Both of these conditions will decrease the fermentation speed and the final yield of vinegar. The organic acid and non-volatile acid content of rosy vinegar produced by pneumatic stirring method were increased, compared with the traditional method. The volatile component content of rosy vinegar produced by pneumatic stirring method and with stirring frequency of 5 d and 7 d is higher than traditional method,increasing from 5 505.83 mg/mL to 6 344.59 mg/mL and 6 062.63 mg/mL, respectively. PCA was performed on volatile components content. The results showed that rosy vinegar produced by pneumatic stirring could be clustered into one class, which was significantly different from rosy vinegar produced with traditional method and rice vinegar produced by self-absorption fermentation.
[1] JIANG Y, LIN S, ZHANG L, et al. Upgrading the fermentation process of Zhejiang rosy vinegar by purebred microorganisms[J].Advances in Microbiology, 2013, 45(3): 297-301. DOI:10.4236/aim.2013.33042.
[2] JIANG Y, GUO J, LI Y, et al. Optimisation of lactic acid fermentation for improved vinegar flavour during rosy vinegar brewing[J]. Journal of the Science of Food & Agriculture, 2010, 90(8): 1334-1339.DOI:10.1002/jsfa.3986.
[3] KARIM K, HOFFMANN R, KLASSON T, et al. Anaerobic digestion of animal waste: waste strength versus impact of mixing[J].Bioresource Technology, 2005, 96(16): 1771-1781. DOI:10.1016/j.biortech.2005.01.020.
[4] MICHELAN R, ZIMMER T R, RODRIGUES J A, et al. Effect of impeller type and mechanical agitation on the mass transfer and power consumption aspects of ASBR operation treating synthetic waste water[J]. Journal of Environmental Management, 2009, 90(5):1357-1364. DOI:10.1016/j.jenvman.2008.08.003.
[5] GOKSEL N D, CHEN S. Anaerobic digestion of dairy manure in a hybrid reactor with biogas recirculation[J]. World Journal of Microbiology & Biotechnology, 2005, 21(6/7): 1509-1514.DOI:10.1007/s11274-005-7371-6.
[6] KARIMK, HOFFMANN R, KLASSONKT, et al. Anaerobic digestion of animal waste: effect of mixing[J]. Water Research, 2005, 96(14):1607-1612. DOI:10.1016/j.watres.2005.06.019.
[7] RUAN F, ZHANG, H. Foundation and evaluation of the product line of Zhejiang rosy vinegar[J]. China Condiment, 2007, 344(10): 62-64.DOI:10.4028/www.scientific.net/amm.866.69.
[8] LIU Y, QIU J, ZHOU L, et al. Isolation and application of moulds from the fermented rice in the traditional Zhejiang rosy vinegar process[J]. China Brewing, 2013, 12(4): 33-37. DOI:10.1016/S1043-4526(09)58004-7.
[9] MILLER G. Use of dinitrosalicylic acid reagent for determination of reducing sugar[J]. Analytical Chemistry, 1959, 31(3): 426-428.DOI:10.1021/ac60147a030.
[10] Inspection of grain and oils-determination of acidity in grain and produce: GB/T 5517-2010[S]. Beijing: China Quality and Standards Publishing & Media Co. Ltd., 2011.
[11] Chinese rice wine: GB/T 13662-2008[S]. Beijing: China Quality and Standards Publishing & Media Co.Ltd., 2008.
[12] WANG Z, LIT, LIU F, et al. Effects of ultrasonic treatment on the maturation of Zhenjiang vinegar[J]. Ultrasonics-Sonochemistry, 2017,39(12): 272-280. DOI:10.1016/j.ultsonch.2017.04.020.
[13] YAMANAKA S. Proceedings of nisshinbo international conference on cellulosics utilization in the near future[J]. Production and Application of Bacterial Cellulose, 1988, 24(1): 175-181. DOI:10.1016/j.ultsonch.2017.04.020.
[14] ROBERTS I S. The biochemistry and genetics of capsular polysaccharide production in bacteria[J]. Annual Review of Microbiology, 1996, 50(1): 285-315. DOI:10.1146/annurev.micro.50.1.285
[15] DEERAKSA A, MOONMANGMEE S, TOYAMA H, et al.Conversion of capsular polysaccharide involved in pellicle formation,to extracellular polysaccharide by galE deletion in Acetobacter tropicalis[J]. Bioscience, Biotechnology, and Biochemistry, 2006,70(10): 2536-2539. DOI:10.1271/bbb.60143.
[16] CHAWALA P R, BAJAJ I B, SURVASE S A, et al. Microbial cellulose: fermentative production and applications[J].Food Technology & Biotechnology, 2009, 47(2): 107-124.DOI:10.1177/1082013208105166.
[17] FERREIRA A, LEITAO J, SILVA I, et al. Distribution of cepacian biosynthesis genes among environmental and clinical Burkholderia strains and role of cepacian exopolysaccharide in resistance to stress conditions[J]. Applied and Environmental Microbiology, 2010, 76(2):441-450. DOI:10.1128/AEM.01828-09.
[18] MATSUSHITA K, EBISUYA H, AMEYAMA M, el. Change of the terminal oxidase from cytochrome α1 in shaking culture to cytochrome O in static culture of Acetobacteraceti[J]. Journal of Bacteriology,1992, 174: 122-129. DOI:10.1128/jb.174.1.122-129.1992.
[19] WALLER G R, FEATHER M S. The Maillard reaction in foods and nutrition. ACS symposium series[J]. American Chemical Society,1983, 121: 197-201. DOI:10.1021/bk-1983-0215.fw001.
[20] ZHAO M, DOU B R, LUO H Y, et al. Study on the fermentation technology and beverage of apple vinegar[J]. Food Industry, 2016,15(2): 37-41. DOI:10.4028/www.scientific.net/amm.866.69.
[21] DEL S A. Chemometric analysis and volatile compounds of traditional balsamic vinegars from Modena[J]. Journal of Food Engineering,2001, 50(2): 77-90. DOI:10.1016/S0260-8774(00)00195-3.
[22] CAMARA J S, ALVES M A, MARQUES J C. Changes in volatile composition of Madeira wines during their oxidative ageing[J].Analytica Chimica Acta, 2006, 563(1/2): 70-77. DOI:10.1016/j.aca.2005.10.031.
[23] CHARLES M, MARTIN B, GINIES C, et al. Potent aroma compounds of two red wine vinegars[J]. Journal of Agricultural &Food Chemistry, 2000, 48(1): 70-77. DOI:10.1021/jf9905424.
[24] UYSAL R S, SOYKUT E A, BOYACI I H, et al. Monitoring multiple components in vinegar fermentation using Raman spectroscopy[J].Food Chemistry, 2013, 141(4): 4333-4343. DOI:10.1016/j.foodchem.2013.06.122.
[25] MA Y, TANG K, XU Y, et al. Characterization of the key aroma compounds in Chinese vidalice wine by gas chromatographyolfactometry, quantitative measurements, aroma recombination, and omission tests[J]. Journal of Agricultural and Food Chemistry, 2017,65(2): 394-401. DOI:10.1021/acs.jafc.6b04509.
[26] DUMITRIU G D, LOPEZD L N, ZAMFIR C I, et al. Volatile and phenolic composition of red wines subjected to aging in oak cask of different toast degree during two periods of time[J]. LWTFood Science and Technology, 2017, 86: 643-651. DOI:10.1016/j.lwt.2017.08.057.
[27] ACENA L, VERA L, GUASCH J, et al. Chemical characterization of commercial sherry vinegar aroma by headspace solid-phase microextraction and gas chromatography-olfactometry[J]. Journal of Agriculture and Food Chemistry, 2011, 59(8): 4062-4070.DOI:10.1021/jf104763u.
[28] XIONG Y, HE Z, LI H, et al. Determination of volatile compounds in Sichuan bran vinegars using head space-solid phase micro-extraction coupled with gas chromatography-mass spectrometry[J]. Food Science, 2011, 32(2): 252-255. DOI:10.1097/RLU.0b013e3181f49ac7.
[29] CHEN S, XU Y, QIANIAN M C. Aroma characterization of Chinese rice wine by gas chromatography-olfactometry, chemical quantitative analysis, and aroma reconstitution[J]. Journal of Agricultural and Food Chemistry, 2013, 61(47): 11295-11302. DOI:10.1021/jf4030536.
[30] RODRIGUEZ-CAMPOS J, ESCALONA-BUENDIA H B, OROZCOAVILA I, et al. Dynamics of volatile and nonvolatile compounds in cocoa (Theobroma cacao L.) during fermentation and drying processes using principal components analysis[J]. Food Research International,2011, 44(1): 250-258. DOI:10.1016/j.foodres.2010.10.028.
[31] LIANG H Y, CHEN J Y, REEVES M, et al. Aromatic and sensorial profiles of young Cabernet Sauvignon wines fermented by different Chinese autochthonous Saccharomyces cerevisiae strains[J].Food Research International, 2013, 51(2): 855-865. DOI:10.1016/j.foodres.2013.01.056.
[32] ZHENG J, LIANG R, WU C. Discrimination of different kinds of Luzhou-flavor raw liquors based on their volatile features[J].Food Research International, 2014, 24(56): 77-84. DOI:10.1016/j.snb.2014.01.054.
[33] KALLITHRAKA S, ARVANITORYANNTS I S, KEFALAS P, et al.Instrumental and sensory analysis of Greek wines; implementation of principal component analysis (PCA) for classification according to geographical origin[J]. Food Chemistry, 2015, 73(4): 501-514.DOI:10.1016/S0308-8146(00)00327-7.
气动搅拌法生产浙江玫瑰醋及其对产品风味的影响