Development of a Validated UPLC Method for Simultaneous Analyses of 20 Ginsenosides in Various Processed Ginseng Products
WANG Yanhong1, WU Xiaomin2, ZHU Yanping1, ZHAO Dan1, LI Yueru1,*
(1. Laboratory of Quality and Safety Risk Assessment for Ginseng and Antler Products, Ministry of Agriculture,Jilin Agricultural University, Changchun 130118, China; 2. The Hospital of Jilin Agricultural University, Changchun 130118, China)
Abstract: A cost effective, simple, precise and accurate ultra-high performance liquid chromatography (UPLC) method was established and validated for simultaneous determination of 20 ginsenosides in various processed ginseng products, including Rg1, Re, Rf, 20(S)-Rg2, 20(R)-Rg2, Rb1, Rc, Ra1, Rb2, Rb3, Rd, Rk3, F2, 20(S)-Rg3, 20(R)-Rg3, compound K (CK), Rg5,20(S)-Rh2, 20(R)-Rh2 and protopanaxadiol (PPD). The developed method was carried out on a Waters ACQUITY UPLC BEH C18 column (2.1 mm × 50 mm, 1.7 µm) using a photodiode array detector (PDA). Good chromatographic separation was performed using a mixture of acetonitrile (B) and water (A) as the mobile phase with gradient elution at a fl ow rate of 0.3 mL/min and column temperature of 30 ℃ within 31 min. The method was well validated with respect to linearity(R2 > 0.998), precision (intra-day RSD ≤ 4.65% and inter-day RSD ≤ 4.88%) and accuracy (recovery rate between 85.71% and 108.50%), and the limit of detection (LOD) and limit of quantification (LOQ) were in the range of 0.81-3.10 µg/mL and 2.88-10.00 µg/mL, respectively. This method was rapid and reliable and was successfully used for the analysis of various processed ginseng products, including freshly stored ginseng, red ginseng and white ginseng and the results revealed significant variations in the ginsenoside levels. This method can be suitable for the analysis of active compounds and the quality control of fresh and processed ginseng.
Keywords: ginseng products; ginsenosides; ultra-high performance liquid chromatography; simultaneous determination;quality control
The root ofPanax ginseng C.A. Meyer. (P. ginseng)within Araliaceae family is a highly favored medicinal plant and has been widely used as an herb in traditional Chinese medicines or functional foods to adjust the balance of the human body in China, Korea, and Japan for over thousands of years[1]. Ginsenosides have been known to be the main bioactive components and have been used as an important index in assessing the quality ofP. ginseng and its products[2].The pharmacological effects of different ginsenosides on human body vary enormously including immunomodulatory,neuroprotective, antifatigue, anti-diabetes, anti-inf l ammation and even anti-cancers[3].
In herbal market, ginseng is commercially available in fresh and its processed products. The fresh ginseng is prepared by simple washing. Because of high water content of fresh ginseng, it is easy to corrupt, and cannot last long. Therefore, ginseng is usually used in processed forms that have a longer shelf-life as compared to fresh ginseng.The most common types of processed ginseng used are red ginseng, white ginseng and fresh-keeping ginseng. Red ginseng is manufactured by steaming the fresh ginseng at 95-100 ℃ for 2-3 h, then drying. White ginseng is produced by drying the fresh ginseng in sunlight. Fresh-keeping ginseng is also a processed ginseng products that can be stored for a long time by washing and maintains freshness processed fresh ginseng[4-5]. However, processed conditions may greatly affect ginseng's chemical constituents, which is the reason for differences among the types of processed ginseng[6].Consequently, each processed ginseng has different health benefits. For example, red ginseng exhibits more potential activity of anti-cancer than white ginseng, due to differences in their ginsenoiside content and profile[7-8]. It is necessary to monitor their ginsenoside compositions in order to elucidate the pharmacological of various processed ginseng products.Thus, the simultaneous determination of multi-ginsenosides has become one of the most important methods to evaluate the intrinsic quality of ginseng.
Though various analytical methods on ginsenosides in ginseng and ginseng-related products have been developed,the simultaneous analysis of multi-ginsenosides is a great challenge due to the diversity, similarity and complexity of the chemical structures. In recent year, high-performance liquid chromatography (HPLC) coupled with different types of detectors has been widely used for the simultaneous analysis of multi-ginsenosides, such as ultraviolet detector, pulsed amperometric detector, evaporative light scattering detector diode array detector and diode array detector[9-14]. But these methods for ginsenosides analysis in various ginseng products had lower sensitivity and suffered from very long analysis time.
Recently HPLC-ESI-MS techniques have been successfully applied to the simultaneous analysis and identification of multi-ginsenosides[15-16]. The modern methods of HPLC-ESI-MS/MS[17-19] and UPLC-QTOF-MS[20-21] for identification and profiling of ginsenoside markers from P. ginseng roots and ginseng functional foods were also reported. And a rapid separation and identification method UPLC-ESI-MS/MS was also established for the determination of multi-ginsenosides[22]. This detection technique is of high sensitivity and qualitative capacity. It is highly suitable for the analysis of small amounts of saponins in ginseng, but it is too expensive for routine analysis in most laboratories.However, ultra-high performance liquid chromatography(UPLC) coupled with photodiode array (PDA) detection provides a solution for these problems and it has been an important analytical tool due to its fast separation, sensitive and good chromatographic resolution[23-24].
In this study, a rapid and sensitive UPLC-PDA method was developed for the simultaneous determination of 20 ginsenosides, including the main and minor or trace amounts of ginsenosides. This newly developed quantitative method with a short analysis period enhances the applicability and the accuracy of the ginsenosides analysis. It can be applied for the quality control of several types of commercial ginseng products and can also be used as a valuable tool for further research on other ginseng-type functional foods.
1 Materials and Methods
1.1 Materials and Reagents
Acetonitrile and methanol of HPLC-grade were obtained from Merck Co. (Merck, Germany). Water was purified by employing a Milli-Q iltration system (Millipore, Billerica,MA, USA). All the other chemicals were at least analytical grade. The reference standards of ginsenosides Rg1, Re,Rf, 20(S)-Rg2, 20(R)-Rg2, Rb1, Rc, Ra1, Rb2, Rb3, Rd,Rk3, F2, 20(S)-Rg3, 20(R)-Rg3, Compound K (CK), Rg5,20(S)-Rh2, 20(R)-Rh2 and protopanaxadiol (PPD) (>98%)were purchased from the National Research Center for Certified Reference (Beijing, China). Fresh-keeping ginseng, red ginseng and white ginseng were purchased from the local ginseng & pilose antler shop (Changchun,Jilin Province, China).
1.2 Instruments and equipment
All analyses were performed using a Waters ACQUITY UPLC H CLASS system (Waters, USA) consisting of a binary solvent manager, a sampler manager, a column compartment, and a PDA detector, all controlled by the Waters Empower 3.0 data station software (Waters, USA).The separations were achieved on an ACQUITY UPLC BEH C18 column (50 mm × 2.1 mm, 1.7 µm) (Waters, USA).
1.3 Methods
1.3.1 Sample preparation
Fresh-keeping ginseng were cut into pieces and dried at 60 ℃, red ginseng and white ginseng were cut into small pieces, then they were all pulverized into powder (40 mesh)and accurately weighed 1.0 g. All the samples were soaked in ether to perform reflux degreasing for 2 h before being ultrasonically extracted (40 kHz, 200 W) three times for 30 min at 30 ℃ in 50 mL of water-saturated n-butanol,respectively.
The extracted solution was then filtered to the evaporating dish and was evaporated to dryness. The residue was dissolved in 10 mL of MeOH. The solution obtained was then fi ltered through a 0.22 µm fi lter membrane and analyzed with UPLC-PDA according to the method mentioned above.Experiments were performed in triplicate.
1.3.2 Preparation of standard solutions
The appropriate amounts of 20 ginsenoside reference compounds were separately dissolved in methanol as the main stock solutions. Then, a standard mixture stock solution was obtained by precisely mixing the 20 ginsenoside stock solutions with methanol. The concentrations were 1 241 µg/mL(Rg1), 1 032 µg/mL (Re), 1 282 µg/mL (Rf), 1 151 µg/mL(20(S)-Rg2), 1 022 µg/mL (20(R)-Rg2), 1 033 µg/mL (Rb1),1 021 µg/mL (Rc), 1 032 µg/mL (Ra1), 1 021 µg/mL (Rb2),1 083 µg/mL (Rb3), 1 172 µg/mL (Rd), 506 µg/mL (Rk3),610 µg/mL (F2), 521 µg/mL (20(S)-Rg3), 516 µg/mL (20(R)-Rg3), 521 µg/mL (CK), 536 µg/mL (Rg5), 516 µg/mL(20(S)-Rh2), 590 µg/mL (20(R)-Rh2) and 576 µg/mL (PPD),respectively in the standard mixture stock solution. All solutions were stored at 4 ℃. According to the experimental requirements, the standard mixture stock solution was further diluted with methanol to obtain a series of calibration standard solutions and filtered through a 0.22 µm syringe fi lter prior to quantitative analysis.
1.3.3 Chromatographic conditions
The mobile phase consisted of water (A) and acetonitrile(B), with a fl ow rate of 0.3 mL/min. The gradient elution was conducted as follows: 19% B (0-3 min), 19%-20% B (3-4 min),20%-22% B (4-5 min), 22%-28% B (5-7 min), 28%-29% B(7-9 min), 29%-35% B (9-14 min), 35%-45% B (14-17 min),45%-57% B (17-20 min), 57%-90% B (20-28 min), 90% B(28-29 min), 90%-19% B (29-30min), 19% B (30-31 min).The column and sample temperatures were set at 30 ℃ and room temperature, respectively. The injection volume was 2.0 µL for all runs. Detection wavelength was set at 203 nm.
1.3.4 Method validation
Method validation was carried out to confirm that the proposed method was suitable for the intended purpose. The linearity, limit of detection (LOD), and limit of quantification(LOQ), precision, accuracy, repeatability and stability were investigated for validation studies.
1.3.4.1 Linearity, LOD and LOQ
The calibration curve and its linearity were determined by injecting calibration standard solutions. The standard mixture stock solution was serially diluted with methanol to 80%, 40%, 20%, 10%, 6%, 4%, 2% and 1% of the concentration of the origin solution to obtain eight different concentrations of calibration standard solutions.Then eight-point calibration curves were constructed by plotting the peak areas against their respective concentrations.The linear regression for each ginsenoside could be calculated from the data as well.
The sensitivity of the method was evaluated by the LOD and LOQ. The lowest concentration of standard solution was further diluted in order to determine the LOD and LOQ. The LOD and LOQ were defined as the minimum concentrations detectable at 3 and 10 times the noise level, respectively.
1.3.4.2 Precision and accuracy
The precision was determined by the intra- and inter-day variations. For intra-day variability test, the mixed standard solution was determined six replicates during a single day,while for inter-day variability test, the mixed standard solution was analyzed in duplicates for three consecutive days. The relative standard deviation (RSD) for peak area was calculated as the measure of precision.
Recovery test was used as estimate of the accuracy.Accurate amount of 20 ginsenosides standard solutions with three different concentration levels were added to 0.5 g of sample and then extracted and analyzed in triplicate as described in sections 2.2 and 2.3. The average recoveries were calculated by the following formula: Recovery/%=((total amount after spiking - original amount in sample)/spiked amount) × 100.
1.3.4.3 Repeatability and stability
The repeatability was examined through the injection of six samples prepared with the same sample preparation procedure. The stability test was performed by analyzing the same sample solutions over period of 0, 2, 4, 8, 12 h and 24 h at room temperature. The RSD of the peak areas of each analyte were taken as the measures of the repeatability and stability.
2 Results and Analysis
2.1 Optimization of extraction condition
According to previous reports, different concentrations of methanol[10,25-26], ethyl alcohol[11] and water-saturated n-butanol were commonly used to treat ginseng samples as extraction solvent[27]. In terms of extraction methods,heat reflux extraction and ultrasonic extraction had been found no significant difference, while the ultrasonic extraction method exhibited low solvent consumption,time-saving and simple operation[28]. In consideration of the premises, ultrasonic extraction was used in this experiment, different extraction solvent, such as 70%methanol-30% water, 80% methanol-20% water, 100%methanol, 70% ethanol-30% water and water-saturated n-butanol, were investigated and compared. The results indicated that 80% methanol-20%water and watersaturatedn-butanol showed the higher extraction rate and the extraction efficiency of these two solvents had no significant difference. However, in consideration of watersaturatedn-butanol as extract solvent can effectively reduce the effect of water-soluble carbohydrates components and other water solubility impurity, and it was not necessary for purifying with SPE columns to be analyzed in UPLC directly, therefore, water-saturatedn-butanol was one of the suitable extraction solvents. Additionally, various factors including extraction time and times, extraction volume and extraction temperature were also investigated. A series of experiments was performed to obtain the optimum results as follows: extraction volume (25, 50, 75, 100 mL) was 50 mL, extraction time (10, 30, 50, 70 min) was 30 minutes,extraction times (1, 2, 3, 4 times) was 3 times and extraction temperature (30, 40, 50 ℃) was 30 ℃.
2.2 Optimization of chromatographic conditions
Optimization of chromatographic conditions was also investigated systematically. The components of saponins are very complex and usually take a long analysis time in HPLC.In order to achieve rapid and efficient analysis and good resolution of adjacent peaks within a short analysis time, a fast UPLC-PDA gradient elution method using acetonitrilewater as the mobile phase was employed. Different types of chromatographic column (a short chromatographic column, BEH C18, 50 mm × 2.1 mm, 1.7 µm, and a long chromatographic column, BEH C18 column, 100 mm ×2.1 mm, 1.7 µm) and fl ow rate (0.2, 0.3, 0.4, 0.5 mL/min)as well as column temperature (20, 30, 40, 50 ℃) were examined and compared, and the mobile phase gradient was also optimized. As a result, The target analytes could be well separated, and good chromatographic peaks could be obtained using acetonitrile-water as mobile phases with gradient elution.
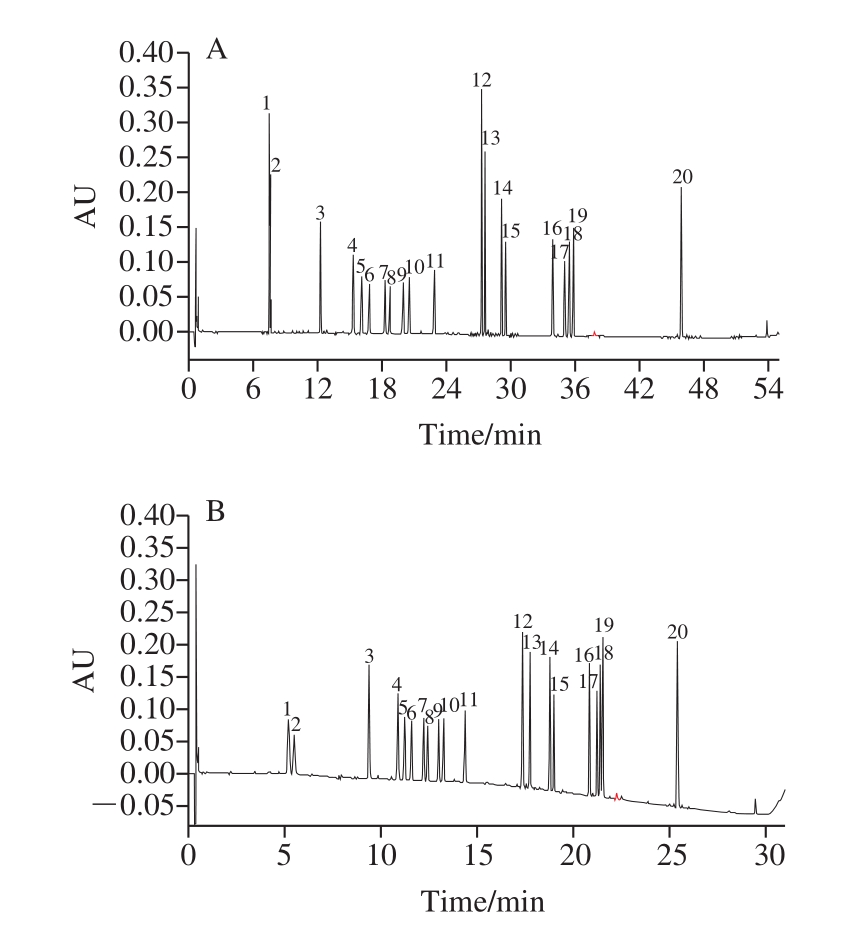
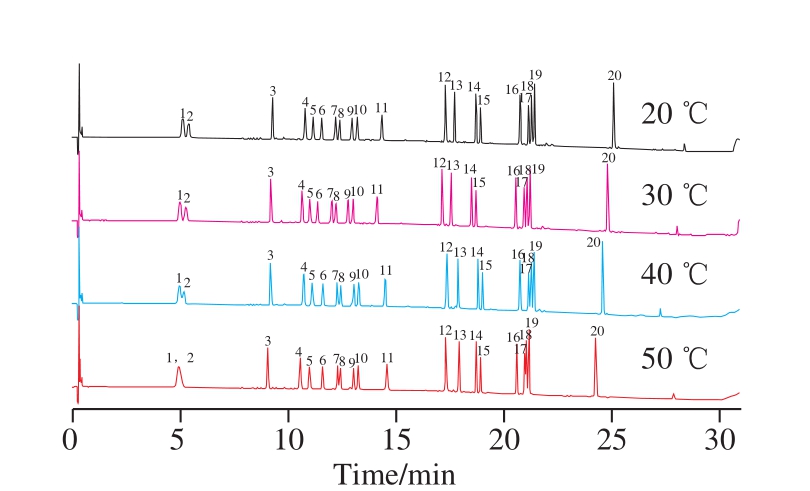
Furthermore, the results of ginsenosides totals show the separation of 20 ginsenosides was faster with short chromatographic column (ACQUITY UPLC BEH C18 column, 50 mm × 2.1 mm, 1.7 µm), which could achieve a baseline separation within 31 min, while it needs 55 min to be completely separated for 20 ginsenosides with a longer chromatographic column (ACQUITY UPLC BEH C18 column, 100 mm × 2.1 mm, 1.7 µm) (as shown in Fig. 1).The flow rate was restricted to 0.3 mL/min to alleviate to pressure, and column temperature also had an important influence on the separation of some ginsenosides such as Rg1 (peak 1) and Re (peak 2), Rc (peak 7) and Ra1 (peak 8),Rg5 (peak 17) and 20(S)-Rh2 (peak 18), with the increase of column temperature, their separation declined. The baseline separation of 20 ginsenosides could be achieved when the column temperature was 30 ℃ or lower (as shown in Fig. 2).A lower column temperature has a higher viscosity of mobile phase than elevated temperature, thus resulting in higher system pressure. Hence, a column temperature of 30 ℃ was chosen for this separation.
2.3 Validation of the analytical method
2.3.1 Linearity of measurement
The linearity, regression and linear ranges of twenty analytes were summarized in Table 1. The result indicated a good relationship between concentrations and peak areas of the analytes within investigated concentration ranges(R2≥0.998). And the linearity ranges were adequate for the determinations of twenty ginsenosides in the samples. The LOD and LOQ obtained for each standard ginsenoside were 0.81-3.10 µg/mL and 2.88-10.00 µg/mL,respectively. Significantly, compared with other studies using HPLC, the LOD and LOQ obtained by this study were closer to those of LC-MS[16,26], and were much lower than those reported in previous publications[11,29], which demonstrated that the newly developed method is more sensitive. Thus, this method can meet the demand for the simultaneous determination of 20 ginsenosides in ginseng and ginseng processed products.
Table 1 Calibration curves, correlation coefficients, linear ranges,LOD and LOQ for 20 ginsenosides in ginseng

Ginsenoside Calibration curvesR2 Linear range/(µg/mL) LOD/(µg/mL) LOQ/(µg/mL)Rg1Y = 2.06 × 10³X- 3.85 × 10² 0.999 6 12.41-744.6 2.98 9.93 ReY = 1.75 × 10³X- 1.52 × 10³ 0.999 4 10.32-619.2 3.10 10.00 RfY = 2.22 × 10³X+ 3.63 × 10³ 0.999 7 12.82-769.2 2.31 5.13 20(S)-Rg2Y = 2.35 × 10³X+ 3.85 × 10³ 0.999 6 11.51-690.6 2.30 5.76 20(R)-Rg2Y = 1.92 × 10³X+ 1.80 × 10³ 0.999 6 10.22-613.2 2.86 8.18 Rb1Y = 1.55 × 10³X- 3.73 × 10² 0.999 4 10.33-619.8 2.89 8.26 RcY = 1.66 × 10³X- 2.14 × 10³ 0.999 3 10.21-612.6 2.86 8.17 Ra1Y = 1.42 × 10³X- 8.45 × 10² 0.999 4 10.32-619.2 2.89 8.26 Rb2Y = 1.71 × 10³X- 2.47 × 10³ 0.999 4 10.21-612.6 2.86 8.17 Rb3Y = 1.63 × 10³X- 1.51 × 10³ 0.999 7 10.83-649.8 2.82 8.66 RdY = 1.80 × 10³X+ 6.50 × 10² 0.999 6 11.72-703.2 2.34 8.20 Rk3Y = 3.73 × 10³X+ 9.77 × 10³ 0.999 3 5.06-303.6 0.81 3.03 F2Y = 2.24 × 10³X+ 8.84 × 10³ 0.999 3 6.10-366.0 0.98 3.49 20(S)-Rg3Y = 2.38 × 10³X+ 1.68 × 10⁴ 0.998 5 5.21-312.6 0.83 3.13 20(R)-Rg3Y = 1.65 × 10³X+ 2.51 × 10⁴ 0.994 6 5.16-309.6 1.03 4.12 CKY = 2.68 × 10³X+ 9.22 × 10³ 0.999 2 5.21-312.6 1.04 3.13 Rg5Y = 1.95 × 10³X+ 1.02 × 10⁴ 0.999 3 5.36-321.6 1.29 3.58 20(S)-Rh2Y = 2.90 × 10³X+ 1.04 × 10⁴ 0.999 2 5.16-309.6 1.03 3.10 20(R)-Rh2Y = 2.96 × 10³X+ 1.47 × 10⁴ 0.999 1 5.90-354.0 0.94 2.95 PPDY = 3.95 × 10³X+ 1.37 × 10⁴ 0.999 1 5.76-345.6 0.92 2.88
2.3.2 The accuracy and intra- and inter-day variations
The accuracy and intra- and inter-day precision obtained were listed in Table 2, which shows the average recoveries of all analytes were ranged between 85.71% and 108.50% with RSD ≤ 4.76%. The good recoveries indicate that the method was sufficiently accurate as a quantitative method for the analysis. The intra-day and inter day precision, expressed as the RSD values of the peak area,were 0.98%-4.65% and 1.35%-4.88%, respectively. The results indicated that the developed method is precise and accurate for simultaneous quantitative evaluation of the twenty ginsenosides in ginseng.
Table 2 Accuracy, intra- and inter-day precision, repeatability and stability in the assay of 20 ginsenosides in ginseng%

Note: ND. not detected. Table 3 the same.
Ginsenoside Average recovery RSD (n=3) Precision RSD (n=6) Repeatability RSD (n=6)Stability RSD(n=6)Low Middle High Intra-day Inter-day Rg1 103.31/0.96 93.94/1.47 100.23/1.48 0.98 1.68 2.09 1.32 Re 104.39/0.98 102.87/1.11 95.80/4.18 1.07 1.35 2.13 1.54 Rf 95.80/0.85 89.14/0.43 97.12/4.48 1.43 2.01 3.21 1.98 20(S)-Rg2 93.92/3.20 105.88/1.14 103.91/3.63 3.14 3.11 4.55 3.11 20(R)-Rg2 108.00/2.88 94.67/4.14 88.00/4.09 ND ND ND ND Rb1 96.68/1.71 97.96/3.51 92.87/2.65 1.22 2.88 4.78 2.44 Rc 93.88/0.83 103.95/3.94 98.17/3.06 2.78 4.21 3.31 3.09 Ra1 104.61/1.77 103.59/3.04 98.58/2.82 1.69 3.35 4.22 2.78 Rb2 95.07/1.91 90.57/1.13 103.74/2.57 3.78 4.78 3.87 2.81 Rb3 92.52/2.99 101.23/2.24 104.63/3.46 3.12 3.17 3.76 1.07 Rd 91.67/3.68 93.18/1.15 95.85/4.56 1.05 2.09 2.01 1.02 Rk3 94.00/1.47 90.77/2.48 97.40/4.34 4.11 4.61 4.55 3.13 F2 92.00/2.34 102.50/3.35 107.14/1.90 3.89 2.93 3.47 4.42 20(S)-Rg3 88.48/2.20 91.43/4.76 103.46/2.95 3.66 3.98 4.98 3.22 20(R)-Rg3 91.25/1.07 85.71/3.18 96.92/1.23 4.32 4.88 4.33 3.67 CK 90.00/3.11 85.88/4.13 93.00/3.12 4.16 3.98 4.76 3.56 Rg5 102.50/4.31 89.72/2.08 92.73/3.11 3.11 2.09 4.95 2.98 20(S)-Rh2 104.44/2.86 88.33/3.27 95.71/4.11 4.65 3.65 4.89 3.85 20(R)-Rh2 91.00/2.33 89.33/3.12 106.50/2.65 ND ND ND ND PPD 107.00/1.36 105.40/4.21 108.50/3.48 ND ND ND ND
2.3.3 Repeatability and stability
Sample repeatability and stability were evaluated through calculating the RSD values of peak areas of six analytes (as shown in Table 2). The repeatability presented as RSD were in the range from 2.01% to 4.98%. As to stability test, the RSD of the peak areas for twenty analytes detected within 24 h were lower than 4.42%, which shows no significant change in the assay of the sample solution after this period of time and no degradation peak was in the resulting chromatogram. It proves that the investigated samples are stable for the routine analysis within a day at room temperature.
2.4 Quantitative analysis of different ginseng samples
The validated UPLC-PDA method was applied for the simultaneous determination of 20 ginsenosides in three types of ginseng samples, including fresh-keeping ginseng,red ginseng and white ginseng. Typical chromatograms of reference compounds (A) and ginsengs samples (B, C and D)were shown in Fig. 3 and the contents of 20 ginsenosides in different ginseng samples are presented in Table 3.
As shown in Table 3, the ginsenosides Rg1, Re, Rf,20(S)-Rg2, Rb1, Rc, Ra1, Rb2, Rb3 and Rd are the main in white ginseng, while a small amount is present as the rare ginsenoside 20(S)-Rg3 and Rk3, which is possibly produced during white ginseng processed. And the ginsenosides 20(R)-Rg2, 20(R)-Rg3, F2, CK, Rg5, 20(S)-Rh2,20(R)-Rh2 and PPD are not detected. The ginsenosides Rg1, Re, Rf, 20(S)-Rg2, Rb1, Rc, Ra1, Rb2, Rb3 and Rd are the main in the fresh-keeping ginseng, there still are a little amount of F2 and PPD. The ginsenosides 20(R)-Rg2,20(S)-Rg3, Rk3, 20(R)-Rg3, CK, Rg5, 20(S)-Rh2 and 20(R)-Rh2 are not detected. But all investigated ginsenosides except 20(R)-Rg2, 20(S)-Rh2 and 20(R)-Rh2 could be detected in red ginseng. The results of total ginsenosides show, the total contents of ginsenosides were highest in white ginseng, secondly red ginseng, and ginsenosides
Total of fresh-keeping ginseng is lowest. In this study task, some ginsenosides cannot be detected in some samples.It may be due to the low levels of ginsenosides, even less than LOQ, leading to be not detected in these samples.
From these results, it can be concluded that the content and compose of ginsenosides exist large differences in the different types of ginseng products such as white ginseng,red ginseng, and fresh-keeping ginseng. Compared with other two kinds of ginseng products, the quality of white ginseng is generally good. Part of ginsenoside monomers in red ginseng is destroyed and transformed because of high-temperature processed, while in fresh-keeping ginseng ginsenoside monomers have enhanced losses due to be soaked in fresh-keeping fluids. The results were in consistence with experimental results reported in literatures[30-31]. These results strongly suggested that guidelines and quality control for commercial ginseng products are required. However, the developed method might be quite suitable and reasonable for quality control of commercial ginseng products since it could cover the majority of the ginsenosides of ginseng samples with different processed methods.
Table 3 Contents of 20 ginsenosides in different ginseng samples (n = 3)mg/g
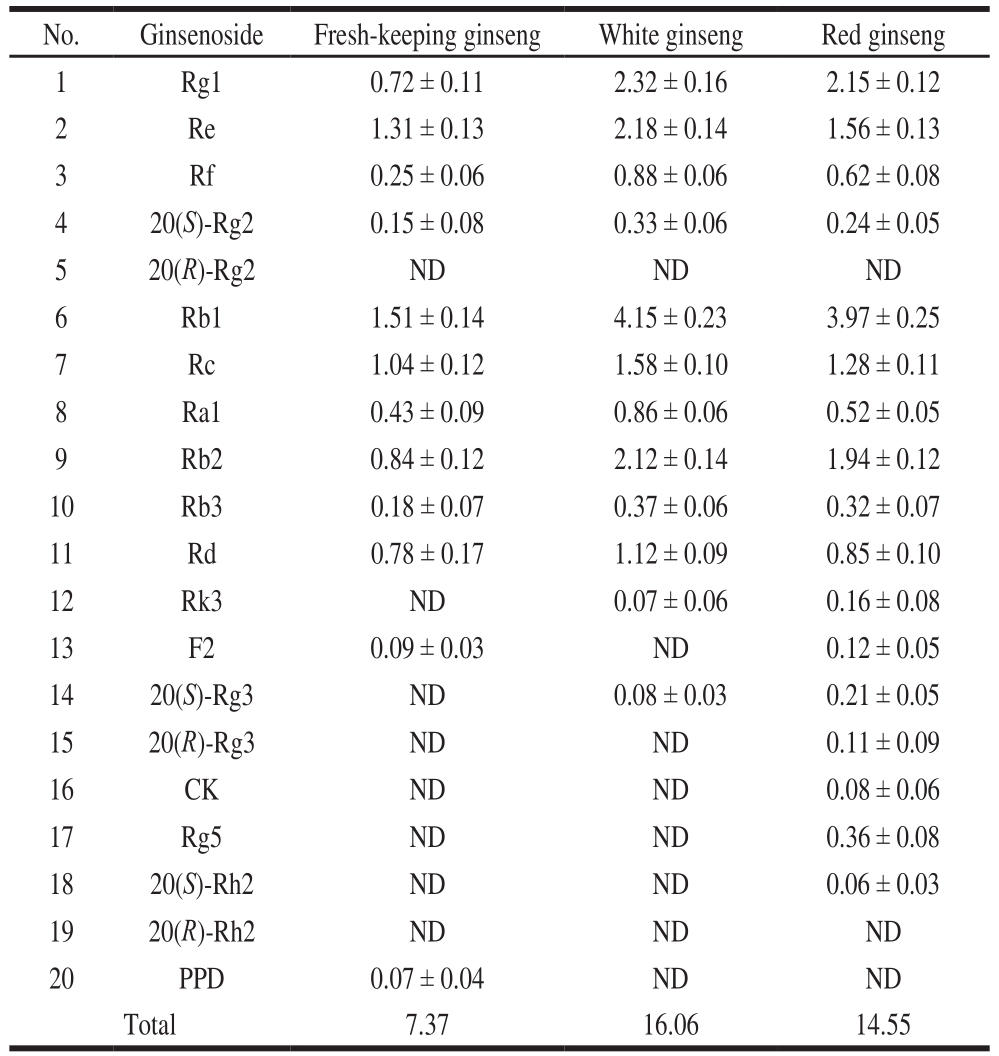
No. Ginsenoside Fresh-keeping ginseng White ginseng Red ginseng 1 Rg1 0.72 ± 0.11 2.32 ± 0.16 2.15 ± 0.12 2 Re 1.31 ± 0.13 2.18 ± 0.14 1.56 ± 0.13 3 Rf 0.25 ± 0.06 0.88 ± 0.06 0.62 ± 0.08 4 20(S)-Rg2 0.15 ± 0.08 0.33 ± 0.06 0.24 ± 0.05 5 20(R)-Rg2 ND ND ND 6 Rb1 1.51 ± 0.14 4.15 ± 0.23 3.97 ± 0.25 7 Rc 1.04 ± 0.12 1.58 ± 0.10 1.28 ± 0.11 8 Ra1 0.43 ± 0.09 0.86 ± 0.06 0.52 ± 0.05 9 Rb2 0.84 ± 0.12 2.12 ± 0.14 1.94 ± 0.12 10 Rb3 0.18 ± 0.07 0.37 ± 0.06 0.32 ± 0.07 11 Rd 0.78 ± 0.17 1.12 ± 0.09 0.85 ± 0.10 12 Rk3 ND 0.07 ± 0.06 0.16 ± 0.08 13 F2 0.09 ± 0.03 ND 0.12 ± 0.05 14 20(S)-Rg3 ND 0.08 ± 0.03 0.21 ± 0.05 15 20(R)-Rg3 ND ND 0.11 ± 0.09 16 CK ND ND 0.08 ± 0.06 17 Rg5 ND ND 0.36 ± 0.08 18 20(S)-Rh2 ND ND 0.06 ± 0.03 19 20(R)-Rh2 ND ND ND 20 PPD 0.07 ± 0.04 ND ND Total 7.37 16.06 14.55
3 Conclusion
This study has developed a simple, rapid, sensitive and accurate UPLC method for simultaneously quantitative analysis of 20 ginsenosides in P. ginseng. During the method development, an effective extraction was achieved and an excellent separation of 20 ginsenosides with BEH C18 column (50 mm × 2.1 mm, 1.7 µm) was achieved in 31 min by a gradient elution. Furthermore, the flow phase is only acetonitrile and water, which solve the problems of the greater loss of phosphate to chromatographic column and the trouble of system cleaning. The method was successfully applied for quality control of different types of ginseng products, including fresh ginseng, red ginseng and white ginseng. The results showed that the qualities of different ginseng products were obviously different, which possibly led to different pharmacological effects. Thus, quality standard should be established to ensure stabile quality of ginseng products. The proposed method could make contribution to compositional analysis and quality control of different types of ginseng products and may be helpful in the development of new compound ginseng preparation due to the simultaneous analysis of many kinds of ginsenosides including the main and minor or trace amounts of ginsenosides.
References:
[1] QI L W, WANG C Z, YUAN C S. Isolation and analysis of ginseng:advances and challenges[J]. Natural Product Reports, 2011, 28(3):467-495. DOI:10.1039/C0NP00057D.
[2] CHOI K T. Botanical characteristics, pharmacological effects and medicinal components of KoreanPanax ginseng C.A. Meyer[J]. Acta Pharmacologica Sinica, 2008, 29(9): 1109-1118. DOI:10.1111/j.1745-7254.2008.00869.x.
[3] LEE C H, KIM J H. A review on the medicinal potentials of ginseng and ginsenosides on cardiovascular diseases[J]. Journal of Ginseng Research,2014, 38(3): 161-166. DOI:10.1016/j.jgr.2014.03.001.
[4] GUI Y, RYU G H. Effects of extrusion cooking on physicochemical properties of white and red ginseng (powder)[J]. Journal of Ginseng Research, 2014, 38(2): 146-153. DOI:10.1016/j.jgr.2013.12.002.
[5] Standardization Administration of China. Grade quality of fresh-keeping ginseng: GB/T 22534-2008[S]. Beijing: Chinese Specification Press, 2008.
[6] CHRISTENSEN L P. Ginsenoside: chemistry, biosynthesis, analysis and potential health effects[J]. Advances in Food and Nutrition Research, 2008, 55: 1-99. DOI:10.1016/S1043-4526(08)00401-4.
[7] KIM Y J, CHOI W I, JEON B N, et al. Stereospecific effects of ginsenoside 20-Rg3 inhibits TGF-β1-induced epithelial-mesenchymal transition and suppresses lung cancer migration, invasion and anoikis resistanc[J]. Toxicology, 2014, 322: 23-33. DOI:10.1016/j.tox.2014.04.002.
[8] LI B, ZHAO J, WANG C Z, et al. Ginsenoside Rh2 induces apoptosis and paraptosis-like cell death in colorectal cancer cells through activation of p53[J]. Cancer Letters, 2011, 301(2): 185-192.DOI:10.1016/j.canlet.2010.11.015.
[9] CORBIT R M, FERREIRA J F S, EBBS S D, et al. Simplified extraction of ginsenosides from American ginseng (Panax quinquefolius L.) for high-performance liquid chromatographyultraviolet analysis[J]. Journal of Agricultural and Food Chemistry,2005, 53(26): 9867-9873. DOI:10.1021/jf051504p.
[10] LEE S I, KWON H J, LEE Y M, et al. Simultaneous analysis method for polar and non-polar ginsenosides in red ginseng by reversed-phase HPLC-PAD[J]. Journal of Pharmaceutical and Biomedical Analysis,2012, 60: 80-85. DOI:10.1016/j.jpba.2011.08.030.
[11] SUN B S, GU L J, FANG Z M, et al. Simultaneous quantification of 19 ginsenosides in black ginseng developed from Panax ginseng by HPLC-ELSD[J]. Journal of Pharmaceutical and Biomedical Analysis,2009, 50(1): 15-22. DOI:10.1016/j.jpba.2009.03.025.
[12] KIM S N, HA Y W, SHIN H, et al. Simultaneous quantification of 14 ginsenosides inPanax ginseng C.A. Meyer (Korean red ginseng)by HPLC-ELSD and its application to quality control[J]. Journal of Pharmaceutical and Biomedical Analysis, 2007, 45(1): 164-170.DOI:10.1016/j.jpba.2007.05.001.
[13] SHI Y, SUN C J, ZHENG B, et al. Simultaneous determination of nine ginsenosides in functional foods by high performance liquid chromatography with diode array detector detection[J]. Food Chemistry,2010, 123(4): 1322-1327. DOI:10.1016/j.foodchem.2010.06.014.
[14] SHAN S M, LUO J G, HUANG F, et al. Chemical characteristics combined with bioactivity for comprehensive evaluation of Panax ginseng C.A. Meyer in different ages and seasons based on HPLCDAD and chemometric methods[J]. Journal of Pharmaceutical and Biomedical Analysis, 2014, 89: 76-82. DOI:10.1016/j.jpba.2013.10.030.
[15] YANG W Z, YE M, QIAO X, et al. A strategy for efficient discovery of new natural compounds by integrating orthogonal column chromatography and liquid chromatography/mass spectrometry analysis: its application in Panax ginseng,Panax quinquefolium and Panax notoginseng to characterize 437 potential new ginsenosides[J].Analytica Chimica Acta, 2012, 739: 56-66. DOI:10.1016/j.aca.2012.06.017.
[16] WANG H P, ZHANG Y B, YANG X W, et al. Rapid characterization of ginsenosides in the roots and rhizomes ofPanax ginseng by UPLC-DAD-QTOF-MS/MS and simultaneous determination of 19 ginsenosides by HPLC-ESI-MS[J]. Journal of Ginseng Research,2016, 40(4): 382-394. DOI:10.1016/j.jgr.2015.12.001.
[17] XIE Y Y, LUO D, CHENG Y J, et al. Steaming-induced chemical transformations and holistic quality assessment of red ginseng derived from Panax ginseng by means of HPLC-ESI-MS/MSn based multicomponent quantification fi ngerprint[J]. Journal of Agricultural and Food Chemistry, 2012, 60(33): 8213-8224. DOI:10.1021/jf301116x.
[18] ZHANG Y C, PI Z F, LIU C M, et al. Analysis of low-polar ginsenosides in steamed Panax ginseng at high-temperature by HPLCESI-MS/MS[J]. Chemical Research in Chinese Universities, 2012,28(1): 31-36.
[19] SHI Y, SUN C, ZHENG B, et al. Simultaneous determination of ten ginsenosides in American ginseng functional foods and ginseng raw plant materials by liquid chromatography tandem mass spectrometry[J]. Food Analytical Methods, 2013, 6(1): 112-122.DOI:10.1007/s12161-012-9406-6.
[20] LI L, LUO G A, LIANG Q L, et al. Rapid qualitative and quantitative analyses of Asian ginseng in adulterated American ginseng preparations by UPLC/Q-TOF-MS[J]. Journal of Pharmaceutical and Biomedical Analysis, 2010, 52(1): 66-72. DOI:10.1016/j.jpba.2009.12.017.
[21] YANG H, LEE D Y, KANG K B, et al. Identification of ginsenoside markers from dry purified extract ofPanax ginsengby a dereplication approach and UPLC-QTOF/MS analysis[J]. Journal of Pharmaceutical and Biomedical Analysis, 2015, 109: 91-104. DOI:10.1016/j.jpba.2015.02.034.
[22] SUN T T, LIANG X L, ZHU H Y, et al. Rapid separation and identification of 31 major saponins in Shizhu ginseng by ultrahigh performance liquid chromatography-electron spray ionization-MS/MS[J]. Journal of Ginseng Research, 2016, 40(3): 220-228.DOI:10.1016/j.jgr.2015.07.008.
[23] NOVÁKOVÁ L, MATYSOVÁ L, SOLICH P. Advantages of application of UPLC in pharmaceutical analysis[J]. Talanta, 2006,68(3): 908-918. DOI:10.1016/j.talanta.2005.06.035.
[24] LIU Y, SONG X, YAN R, et al. Development and validation of a UPLC-DAD-MS method for characterization and quantification of alkaloids inMenispermi Rhizoma and its preparations[J]. Journal of Food and Drug Analysis, 2013, 21(2): 206-218. DOI:10.1016/j.jfda.2013.05.012.
[25] PARK H W, IN G, HAN S T, et al. Simultaneous determination of 30 ginsenosides inPanax ginsengpreparations using ultra performance liquid chromatography[J]. Journal of Ginseng Research, 2013, 37(4):457-467. DOI:10.5142/jgr.2013.37.457.
[26] STAVRIANIDI A, STEKOLSHCHIKOVA E, POROTOVA A, et al.Combination of HPLC-MS and QAMS as a new analytical approach for determination of saponins in ginseng containing products[J].Journal of Pharmaceutical and Biomedical Analysis, 2017, 132: 87-92.DOI:10.1016/j.jpba.2016.09.041.
[27] PAN J Y, CHENG Y Y, WANG Y, et al. A method of smiultaneous determination of 9 ginsenosides for identifying the quality of ginseng[J]. Chinese Journal of Analytical Chemistry, 2005, 33(11):1565-1568. DOI:10.3321/j.issn:0253-3820.2005.11.012.
[28] IN G, AHN N G, BAE B S, et al. New method for simultaneous quantification of 12 ginsenosides in red ginseng powder and extract:in-house method validation[J]. Journal of Ginseng Research, 2012,36(2): 205-210. DOI:10.5142/jgr.2012.36.2.205.
[29] LEE G J, SHIN B K, YU Y H, et al. Systematic development of a group quantification method using evaporative light scattering detector for relative quantification of ginsenosides in ginseng products[J].Journal of Pharmaceutical and Biomedical Analysis, 2016, 128: 158-165. DOI:10.1016/j.jpba.2016.05.030.
[30] YANG Y W, MENG F S, GAO Y G, et al. Simultaneous determination of twenty ginsenosides in ginseng preparations by HPLC[J]. Food Science,2016, 37(22): 131-135. DOI:10.7506/spkx1002-6630-201622019.
[31] LIU Z, RUAN C C, LIU T Z, et al. Simultaneous determination of 14 kinds of ginsenosides in similar wild ginseng, fresh ginseng, white ginseng, and red ginseng by HPLC[J]. Chinese Traditional and Herbal Drugs, 2012, 43(12): 2431-2434.
收稿日期:2018-01-03
基金项目:国家农产品质量安全风险评估重大专项(GJFP201701002);吉林省科技发展计划项目(20170203007YY)
第一作者简介:王艳红(1974—)(ORCID: 0000-0003-1894-6614),女,副教授,博士,研究方向为中药化学及农产品质量安全。E-mail: yanhong-w@163.com
*通信作者简介:李月茹(1964—)(ORCID: 0000-0002-8323-6662),女,教授,博士,研究方向为天然产物化学及农产品质量安全。E-mail: yutong7004@126.com
同时测定不同人参加工产品中20 种人参皂苷的UPLC-PDA方法开发和验证
王艳红1,吴晓民2,朱艳萍1,赵 丹1,李月茹1,*
(1.吉林农业大学 农业部参茸产品质量安全风险评估实验室,吉林 长春 130118;2.吉林农业大学医院,吉林 长春 130118)
摘 要: 建立一种简单、有效、精密和准确的超高效液相色谱方法评价不同人参加工产品的质量,同时快速测定20 种人参皂苷Rg1、Re、Rf、20(S)-Rg2、20(R)-Rg2、Rb1、Rc、Ra1、Rb2、Rb3、Rd、Rk3、F2、20(S)-Rg3、20(R)-Rg3、Compound K(CK)、Rg5、20(S)-Rh2、20(R)-Rh2和protopanaxadiol(PPD)。采用二极管阵列检测器和ACQUITY UPLC BEH-C18(2.1 mm×50 mm,1.7 µm)色谱柱,以乙腈-水为流动相,流速0.3 mL/min,柱温30 ℃,梯度洗脱。20 种人参皂苷在31 min内可达到良好的分离,考察方法的线性范围、回收率、日内和日间精密度。在本方法条件下,线性关系良好,相关系数R2均大于0.998,日内相对标准偏差不大于4.65%,日间相对标准偏差不大于4.88%,回收率为85.71%~108.50%。方法检出限为0.81~3.10 µg/mL,方法定量限为2.88~10.00 µg/mL。本方法快速、可靠,已成功用于不同人参加工产品包括保鲜参、红参和白参中20 种人参皂苷的分析检测,有效揭示不同人参加工产品中人参皂苷含量水平的显著变化,可用于鲜人参及其加工产品中活性化合物的分析和质量控制。
关键词: 人参产品;人参皂苷;超高效液相色谱;同时测定;质量控制
中图分类号:R286
文献标志码:A
文章编号:1002-6630(2019)06-0253-08
引文格式:WANG Yanhong, WU Xiaomin, ZHU Yanping, et al. Development of a validated UPLC method for simultaneous analyses of 20 ginsenosides in various processed ginseng products[J]. 食品科学, 2019, 40(6): 253-260. DOI:10.7506/spkx1002-6630-20180103-040. http://www.spkx.net.cn
DOI:10.7506/spkx1002-6630-20180103-040
WANG Yanhong, WU Xiaomin, ZHU Yanping, et al. Development of a validated UPLC method for simultaneous analyses of 20 ginsenosides in various processed ginseng products[J]. Food Science, 2019, 40(6): 253-260. DOI:10.7506/spkx1002-6630-20180103-040. http://www.spkx.net.cn