美味牛肝菌(Boletus edulis Bull. Fr.)又名大脚菇,隶属于牛肝菌科(Boletaceae),是世界上著名的野生食用菌,在欧洲被称为“王者牛肝菌”[1-2]。野生食用菌肉质肥厚细软、味道鲜美,富含人体所需的多种矿质元素,具有较大的食用药用价值,是多国消费者喜爱的食物[3]。适量摄入矿质元素对维持人体机能具有重要作用[4-5];如Zn是影响生长发育、生殖遗传、免疫功能的重要物质,也是脑损伤后细胞凋亡和神经元死亡的重要调节因子[6]。Zn缺乏会导致免疫力低下、厌食、智力下降。Zn摄入过多会引起Zn中毒,产生腹痛、腹泻、眩晕、脱水等症状。Fe则是红细胞中血红蛋白的重要组成部分,参与氧化还原反应,是细胞呼吸与增殖、氧运输、能量代谢的关键物质[7]。缺Fe会引起缺铁性贫血,Fe摄入过多会引起恶心、呕吐、腹痛等症状,严重可导致肝硬化和肠道出血坏死。而重金属会对人体产生毒害作用,如Pb和Cd会持续损害人体肝脏、肾脏等重要器官[8]。野生食用菌对矿质元素的富集能力高于其他栽培菌和蔬菜[9-10];因此,野生食用菌矿质元素膳食摄入比例和暴露风险评估对于人体健康安全评价具有重要意义。
Kojta[11]、Lipka[12]等研究牛肝菌子实体中矿质元素含量,结果表明Mg、Zn、Fe、Ca、Mn等矿质元素含量较高,有毒元素Cd、As、Hg含量较低,必需元素含量丰富;矿质元素是人体必不可少的营养物质,适量食用可补充人体所需。Wang Xuemei等[13]采用电感耦合等离子体发射光谱法测定8 种野生食用菌中Co、Cu、Fe、Mn、Ni、Zn的含量,结果表明食用菌中元素之间存在显著相关,子实体中富集的重金属元素与产地有关。Gençcelep[14]、Kalac[15]等对食用菌元素含量进行研究,结果显示大部分野生食用菌中积累了有毒元素Cd和Hg;但必需元素含量远高于有毒元素。
本实验采用电感耦合等离子体发射光谱法测定云南8 个产地171 个美味牛肝菌子实体中与人体健康密切相关的14 种矿质元素含量,其中包括人体常量元素Ca、Mg、Na,微量元素Fe、Zn、Sr、Mn、Cu、Cr和有害元素Cd等。采用相关性分析和主成分分析(principal component analysis,PCA)法分析不同产地美味牛肝菌矿质元素特征和富集情况,并进行健康风险评估。
1 材料与方法
1.1 材料与试剂
采集云南8 个地区171 份大小相等且成熟的美味牛肝菌样品,均由云南农业大学资源与环境学院范茂攀博士鉴定为美味牛肝菌。用陶瓷刀刮去泥土,杂草等异物。清水和超纯水清洗干净后置于恒温箱50 ℃烘干至恒质量,粉碎后过100 目标准筛。常温保存于聚乙烯自封袋备用。详细采集地点见表1。
表1 样品产地及代码编号
Table 1 Geographical origin and number of samples

images/BZ_289_1276_2324_2252_2367.png云南昆明 A 1~49 49云南楚雄 B 50~75 26云南玉溪 C 76~113 38云南迪庆 D 114~130 17云南大理 E 131~147 17云南保山 F 148~157 10云南文山 G 158~164 7云南曲靖 H 165~171 7
茶叶标准物质GBW07605 地矿部物化探研究所;65%硝酸(优级纯)、30%过氧化氢(分析纯)、14 种矿质元素标准溶液 济南众标科技有限公司;超纯水(电阻率>18.25 MΩ·cm) 优谱科技有限公司。
器皿均用15%硝酸溶液浸泡过夜,用超纯水润洗3 遍后烘干备用。
1.2 仪器与设备
ICPE-9000全谱发射光谱仪 日本岛津公司;Mars6微波消解仪 美国CEM公司;AR1140型万分之一分析天平 梅特勒-托利多仪器上海有限公司;FW-100型高速粉碎机 天津市华鑫仪器厂;100 目标准筛盘浙江上虞市道墟五四仪器厂;UPT-I-10超纯水机 优谱科技有限公司。
1.3 方法
1.3.1 元素含量测定
每份样品称取(500±0.20)mg,置于微波消解罐中,加入5 mL硝酸、2 mL 30%过氧化氢溶液和3 mL超纯水,常温下消解2 h后在微波消解仪中进行消解,消解条件见表2。消解液转置25 mL比色管,用超纯水定容至25 mL,摇匀,澄清后每个样品测定3 次,取平均值。均以干质量计。
表2 微波消解条件
Table 2 Microwave digestion conditions

images/BZ_290_224_1384_1204_1431.png15120 5 1 500 2 150 5 1 500 3 5 170 5 1 500 5 4 5 180 10 1 500
1.3.2 建立茶叶标准物标准曲线
取Ba、Cd、Co、Cr、Ni、Sr、V元素标准储备液,加入10%硝酸溶液配制成0.00、0.02、0.05、0.10、0.50、1.00 μg/mL标准溶液,取Ca、Cu、Na、Zn、Fe、Mg、Mn标准溶液加入10%硝酸溶液配制成0.00、0.50、1.00、5.00、10.00、20.00 μg/mL标准溶液,建立元素标准曲线。
1.4 数据处理
将所测不同产地美味牛肝菌矿质元素含量原始数据进行Z-score标准化处理,消除量纲影响,用SPSS统计软件进行PCA。其中PCA数据模型为[16-18]:

式中:Anm表示X的协助方差阵Σ的特征值对应的特征变量;n 个指标记为X1,X2…Xn;n 个指标标准化后记为Z(X1),Z(X2),…,Z(Xn)。数据分析中存在指标的量纲不同,消除量纲的影响有利于减少误差。
2 结果与分析
2.1 测定方法考察结果
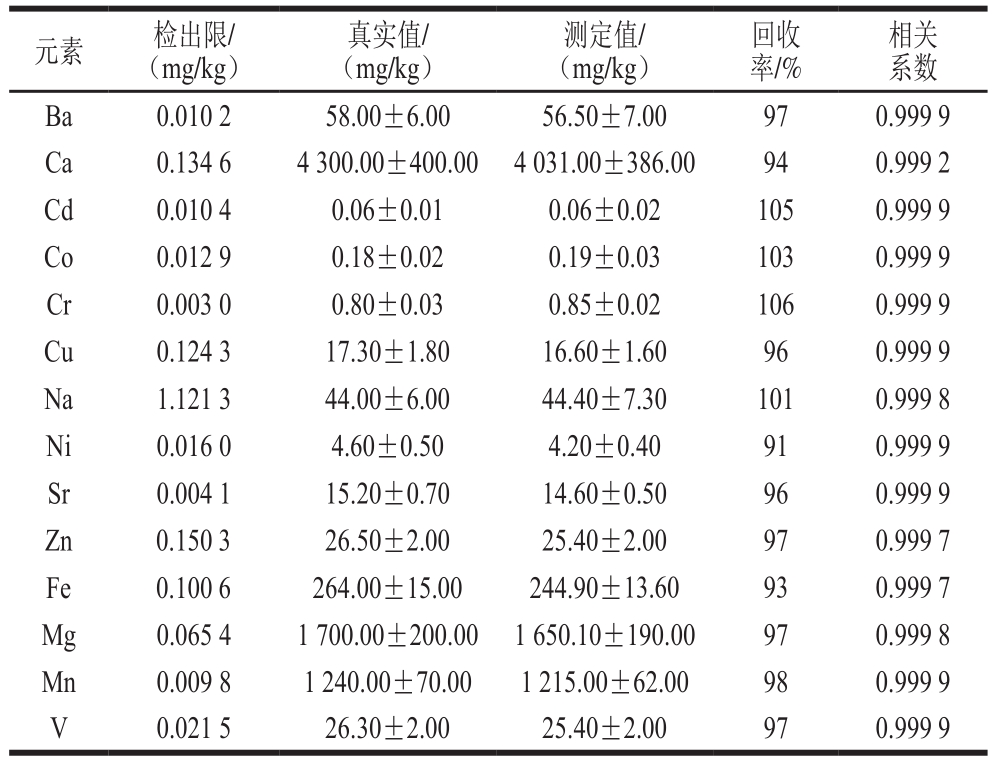
利用国家标准茶叶标准物(GBW 07605)对测定方法的准确性和精密度进行验证。如表3所示,14 种元素的检出限范围在0.003~1.121 3 mg/kg之间,回收率在91%~106%之间,标准曲线回归方程相关系数均大于0.999,大部分矿质元素的测定值在国家标准参考值范围内,并且无限接近。结果表明该方法准确可靠,可用于美味牛肝菌中矿质元素测定。
表3 茶叶标准物(GBW 07605)的矿质元素含量及方法检出限
Table 3 Determined and certified values of mineral elements in tea standard (GBW 07605) and detection limits of the established method

元素 检出限/(mg/kg)相关系数Ba 0.010 2 58.00±6.00 56.50±7.00 97 0.999 9 Ca 0.134 6 4 300.00±400.00 4 031.00±386.00 94 0.999 2 Cd 0.010 4 0.06±0.01 0.06±0.02 105 0.999 9 Co 0.012 9 0.18±0.02 0.19±0.03 103 0.999 9 Cr 0.003 0 0.80±0.03 0.85±0.02 106 0.999 9 Cu 0.124 3 17.30±1.80 16.60±1.60 96 0.999 9 Na 1.121 3 44.00±6.00 44.40±7.30 101 0.999 8 Ni 0.016 0 4.60±0.50 4.20±0.40 91 0.999 9 Sr 0.004 1 15.20±0.70 14.60±0.50 96 0.999 9 Zn 0.150 3 26.50±2.00 25.40±2.00 97 0.999 7 Fe 0.100 6 264.00±15.00 244.90±13.60 93 0.999 7 Mg 0.065 4 1 700.00±200.00 1 650.10±190.00 97 0.999 8 Mn 0.009 8 1 240.00±70.00 1 215.00±62.00 98 0.999 9 V 0.021 5 26.30±2.00 25.40±2.00 97 0.999 9真实值/(mg/kg)测定值/(mg/kg)回收率/%
2.2 元素含量分析
2.2.1 不同产地美味牛肝菌中14 种矿质元素含量
表4 美味牛肝菌元素含量
Table 4 Element contents of B. edulis mg/kg

images/BZ_290_1299_1986_2275_2033.pngBa 65.03±67.58 7.60±5.21 37.88±40.05 114.98±49.00 36.24±34.14 69.58±24.87 60.31±8.71 23.54±5.83 Ca 383.86±269.03 592.89±409.30 261.97±188.33 269.90±102.81 171.93±72.51 278.98±29.12 390.86±223.19 125.33±18.16 Cd 20.38±49.97 0.95±0.92 28.69±93.01 5.53±2.54 26.86±67.82 8.70±6.75 4.25±0.81 28.24±9.70 Co 3.07±4.39 0.59±0.46 3.12±5.56 8.85±7.26 5.76±4.46 7.96±3.21 13.22±3.86 1.12±2.14 Cr 77.92±124.72 27.94±42.79 61.21±96.80 29.79±18.06 67.45±139.04 203.05±187.81 166.22±131.02 18.49±7.23 Cu 37.74±30.67 240.17±409.42 37.51±41.94 32.98±11.50 26.92±15.91 24.87±5.28 19.77±1.82 49.98±7.00 Fe 1 195.01±977.02 1 390.91±1 241.38 659.72±648.68 2 590.14±2 211.86 826.27±761.76 1 945.19±312.09 3 568.50±605.36 731.83±197.83 Mg 618.23±328.14 1 045.33±452.11 596.00±283.48 306.93±116.15 458.36±282.48 445.75±230.61 350.04±21.94 767.79±181.99 Mn 40.89±23.38 39.50±22.41 33.93±23.76 49.35±27.33 30.26±30.26 41.73±14.75 71.46±16.25 30.43±2.91 Na 343.48±397.07 102.32±82.94 287.01±271.71 143.30±153.11 206.86±203.58 170.00±233.71 50.56±17.84 243.55±18.51 Ni 21.47±24.60 3.42±2.84 31.90±59.95 62.68±37.30 26.28±13.05 34.18±5.42 37.15±4.09 8.98±4.65 Sr 35.54±63.83 1.77±1.16 9.79±8.01 29.11±17.59 6.23±3.60 12.75±2.67 15.31±3.55 3.99±3.70 V 20.92±22.72 3.00±2.73 9.24±12.33 41.36±45.76 17.69±14.75 32.92±6.75 46.91±8.28 18.44±5.20 Zn 91.01±55.19 157.50±150.70 88.69±46.53 46.77±21.41 63.59±48.43 74.40±25.50 48.43±5.65 94.54±35.72
如表4所示,美味牛肝菌中人体必需常量元素Ca、Mg、Na含量丰富,范围为125.33~592.89、306.93~1 045.33、50.56~343.48 mg/kg。每日膳食所需的微量元素Fe、Zn、Cr、Cu在美味牛肝菌中含量较多,范围为659.72~3568.50、46.77~157.50、18.49~203.05、19.77~240.17 mg/kg。与Brzezicha-Cirocka[19]和Falandysz[20]等研究结果一致。有毒元素Cd含量为0.95~28.69 mg/kg,其中玉溪产的美味牛肝菌含量最高,其次是曲靖(28.24 mg/kg),与Ivan等[21]研究Cd含量(0.27~5.81 mg/kg)和Frankowska等[22]研究美味牛肝菌Cd含量(1.70~5.50 mg/kg)差异较大,可能与产区地理环境和土壤中Cd的含量有关。美味牛肝菌中Cd的富集能力高于其他食用菌,如鸡油菌[23](0.21~0.41 mg/kg)、平菇[2 4](0.0 1~0.5 8 μ g/g)、绒柄牛肝菌[2 5](0.16~0.32 mg/kg),且不同产地之间Cd含量存在差异。美味牛肝菌中Co含量最少,平均值为5.46 mg/kg。Fe元素含量最高,平均值为1 613.45 mg/kg;富含Fe的真菌类食物中多糖小肽类物质有利于提供Fe的吸收[26],食用美味牛肝菌,可能是补Fe的良好来源。
2.2.2 不同产地美味牛肝菌中14 种矿质元素含量的相关性分析
表5 牛肝菌元素相关系数
Table 5 Correlation coefficients among elements in B. edulis

注:*.在0.05水平(双侧)上显著相关;**.在0.01水平(双侧)上极显著相关。
images/BZ_291_201_1346_1181_1397.pngBa 1 Ca 0.065 1 Cd 0.227** 0.093 1 Co 0.502** 0.099 0.440** 1 Cr 0.416** 0.124 0.360** 0.531** 1 Cu -0.161*-0.069-0.034 -0.120 -0.095 1 Fe 0.472** 0.274**0.152* 0.713** 0.484**-0.078 1 Mg-0.227**0.293**0.173*-0.223**0.158* 0.153* 0.052 1 Mn 0.405** 0.414**0.256** 0.659** 0.571**-0.037 0.718** 0.063 1 Na 0.038 -0.234 0.145 -0.119 0.221**-0.064-0.149 0.389** -0.120 1 Ni 0.430** -0.030 0.066 0.434** 0.131 -0.070 0.380**-0.182*0.216** 0.120 1 Sr 0.710** 0.096 -0.011 0.163* -0.025-0.103 0.125 -0.294** 0.101-0.181*0.110 1 V 0.527** 0.098 0.219** 0.771** 0.490**-0.130 0.837**-0.189*0.624**-0.040 0.467**0.156* 1 Zn -0.132 -0.064 0.198** -0.112 0.084 0.787**-0.072 0.467** -0.002 0.292**-0.100-0.183*-0.134 1
表5为Pearson相关系数(r)矩阵,当r>0时,表示2 种元素之间存在协同作用,一种元素促进另一种元素吸收;当r<0时,表示2 种元素之间存在拮抗作用,一种元素抑制另一种元素吸收[27]。由表5可知,美味牛肝菌中有毒元素Cd含量与Fe、Mg呈显著正相关,与Ba、Co、Cr、Mn、V、Zn呈极显著正相关,表明菌体对Cd的富集作用可能与Fe、Mg、Ba、Co、Cr、Mn、V、Zn之间存在着较好的协同作用。元素Ba与Co、Cr、Fe、Mn、Ni、Sr、V,Ca与Fe、Mg、Mn,Co与Cr、Fe、Mn、Ni、V,Cr与Fe、Mn、Na、V,Cu与Zn,Fe与Ni、V,Mg与Na、Zn,Mn与Ni、Fe、V,Ni与Mn、V呈极显著正相关。元素Mg与Cr、Cu,Sr与Co、V呈显著正相关。元素Ba与Cu呈显著负相关,与Mg呈极显著负相关。Ca与Na呈极显著负相关。Mg与Co、Sr呈极显著负相关,与V呈显著负相关。Sr与Na、Zn呈显著负相关。结果表明,美味牛肝菌元素间存在着复杂的相互作用,大部分元素之间以协同作用为主,部分元素之间存在拮抗作用。
2.2.3 不同产地美味牛肝菌中14 种矿质元素的PCA
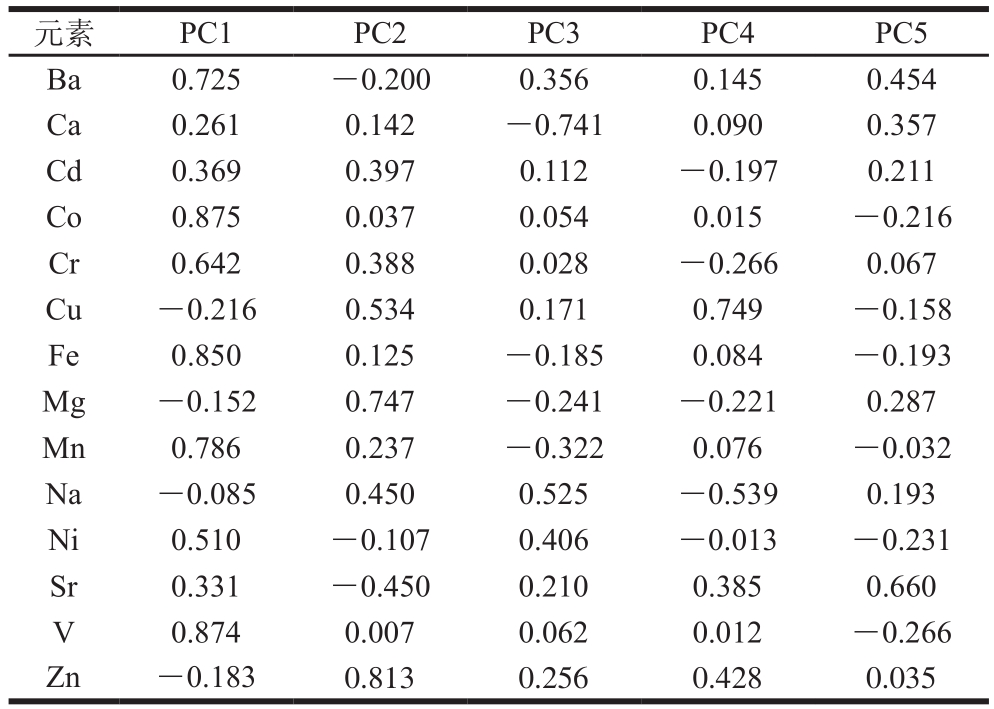
PCA法是一种多元统计技术,利用降维的思想,把多个变量简化为少数几个综合变量简化数据结构[18]。将标准化后的美味牛肝菌矿质元素含量进行PCA。根据检验统计量(Kaiser-Meyer-Olkin,KMO)的结果为0.638,大于最低标准0.5。其中公因子方差,每一个元素变量的共性方差大部分都在0.5以上,且大多数接近或超过0.7,说明这5 个主成分能够很好地反映原始变量的大部分信息。如表6所示,提取前5 个特征值大于1的成分,其累计贡献率达到了77.731%,能够代表原始信息的77.731%。PC1的特征值为4.493,贡献率占总贡献率的32.090%,由表7可知,Ba、Co、Cr、Fe、Mn、V等矿物质中PC1中载荷值较高,分别为0.725、0.875、0.642、0.850、0.786、0.874。PC2的特征值为2.362,贡献率占总方差贡献率的16.873%,Mg和Zn在PC2的载荷值较大,为0.747与0.813。
表6 主成分特征值及贡献率
Table 6 Eigenvalues and contribution rates of principal components to total variance

images/BZ_291_1276_1547_2256_1595.png14.493 32.090 32.090 2 2.362 16.873 48.963 3 1.471 10.508 59.471 4 1.384 9.800 69.359 5 1.172 8.372 77.731
表7 成分载荷矩阵
Table 7 Component loading matrix

images/BZ_291_1276_1974_2253_2020.pngBa 0.725 -0.200 0.356 0.145 0.454 Ca 0.261 0.142 -0.741 0.090 0.357 Cd 0.369 0.397 0.112 -0.197 0.211 Co 0.875 0.037 0.054 0.015 -0.216 Cr 0.642 0.388 0.028 -0.266 0.067 Cu -0.216 0.534 0.171 0.749 -0.158 Fe 0.850 0.125 -0.185 0.084 -0.193 Mg -0.152 0.747 -0.241 -0.221 0.287 Mn 0.786 0.237 -0.322 0.076 -0.032 Na -0.085 0.450 0.525 -0.539 0.193 Ni 0.510 -0.107 0.406 -0.013 -0.231 Sr 0.331 -0.450 0.210 0.385 0.660 V 0.874 0.007 0.062 0.012 -0.266 Zn -0.183 0.813 0.256 0.428 0.035
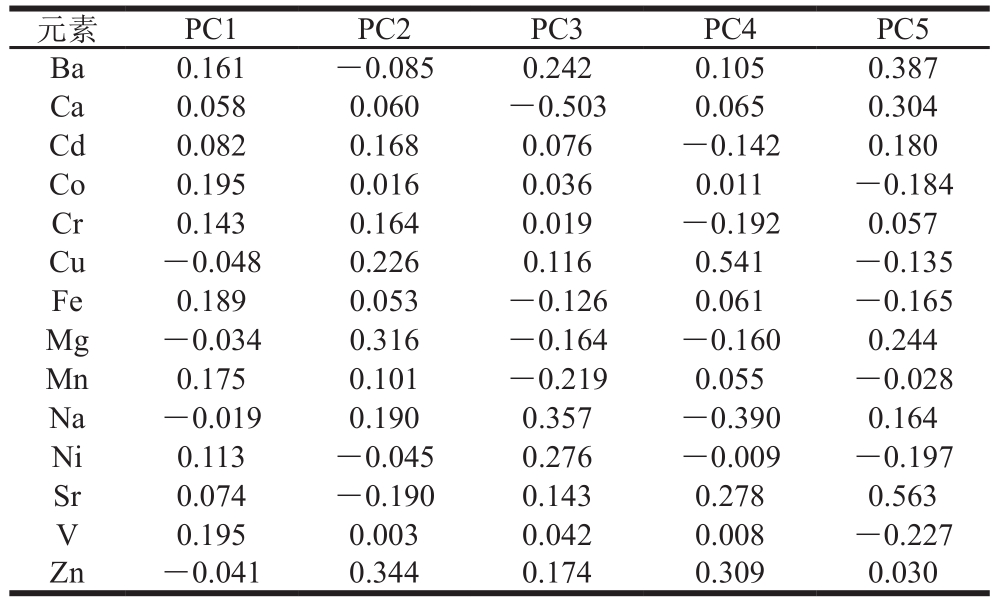
表8为主成分得分相关系数,根据主成分计算公式和主成分得分相关系数可以得到前5 个主成分与14 种元素含量的线性组合为:
F1=0.161Z(Ba)+0.058Z(Ca)+0.082Z(Cd)+0.195Z(Co)+0.143Z(Cr)-0.048Z(Cu)+0.189Z(Fe)-0.034Z(Mg)+0.175Z(Mn)-0.019Z(Na)+0.113Z(Ni)+0.074Z(Sr)+0.195Z(V)-0.041Z(Zn)
F2=-0.085Z(Ba)+0.060Z(Ca)+0.168Z(Cd) +0.016Z(Co)+0.164Z(Cr)+0.226Z(Cu)+0.053Z(Fe)+0.316Z(Mg)+0.101Z(Mn)+0.190Z(Na)-0.045Z(Ni)-0.190Z(Sr)+0.003Z(V)+0.344Z(Zn)
F3=0.242Z(Ba)-0.503Z(Ca)+0.076Z(Cd)+0.036Z(Co)+0.019Z(Cr)+0.116Z(Cu)-0.126Z(Fe)-0.164Z(Mg)-0.219Z(Mn)+0.357Z(Na)+0.276Z(Ni)+0.143Z(Sr)+0.042Z(V)+0.174Z(Zn)
F4=0.105Z(Ba)+0.065Z(Ca)-0.142Z(Cd)+0.011Z(Co)-0.192Z(Cr)+0.541Z(Cu)+0.061Z(Fe)-0.160Z(Mg)+0.055Z(Mn)-0.390Z(Na)-0.009Z(Ni)+0.278Z(Sr)+0.008Z(V)+0.309Z(Zn)
F5=0.387Z(Ba)+0.304Z(Ca)+0.180Z(Cd)-0.184Z(Co)+0.057Z(Cr)-0.135Z(Cu)-0.165Z(Fe)+0.244Z(Mg)-0.028Z(Mn)+0.164Z(Na)-0.197Z(Ni)+0.563Z(Sr)-0.227Z(V)+0.030Z(Zn)
表8 主成分得分系数矩阵
Table 8 Principal component score coefficient matrix

images/BZ_292_224_1559_1203_1598.pngBa 0.161 -0.085 0.242 0.105 0.387 Ca 0.058 0.060 -0.503 0.065 0.304 Cd 0.082 0.168 0.076 -0.142 0.180 Co 0.195 0.016 0.036 0.011 -0.184 Cr 0.143 0.164 0.019 -0.192 0.057 Cu -0.048 0.226 0.116 0.541 -0.135 Fe 0.189 0.053 -0.126 0.061 -0.165 Mg -0.034 0.316 -0.164 -0.160 0.244 Mn 0.175 0.101 -0.219 0.055 -0.028 Na -0.019 0.190 0.357 -0.390 0.164 Ni 0.113 -0.045 0.276 -0.009 -0.197 Sr 0.074 -0.190 0.143 0.278 0.563 V 0.195 0.003 0.042 0.008 -0.227 Zn -0.041 0.344 0.174 0.309 0.030
根据F=0.320 90F1+0.168 73F2+0.105 08F3+0.098 89F4+0.083 72F5计算主成分得分和排序,结果见表9。8 个产地美味牛肝菌元素含量最高的是迪庆,其次是文山、昆明、保山、楚雄、玉溪、大理和曲靖。可能与不同产地之间的环境、气候、土壤等多种生态因子差异有关。
表9 主成分综合得分
Table 9 Comprehensive scores of principal components

images/BZ_292_224_2695_1204_2742.pngA -0.061 5 0.065 8 0.593 0 -0.239 0 1.999 4 0.197 4 3 B -1.357 9 1.811 3 -1.955 9 2.023 5 0.096 8 -0.127 4 5 C -0.630 0 0.297 5 0.658 0 -0.875 2 0.383 1 -0.137 3 6 D 1.168 2 -1.518 8 0.826 0 0.746 7 -0.134 9 0.268 0 1 E -0.449 7 -0.296 9 0.560 4 -0.873 0 -0.482 9 -0.262 3 7 F 0.647 9 -0.225 4 0.211 5 -0.377 0 -0.401 3 0.121 2 4 G 1.742 3 -0.654 1 -1.316 6 0.376 6 -1.351 7 0.234 5 2 H -1.059 2 0.520 7 0.423 7 -0.782 6 -0.108 6 -0.294 0 8
2.3 健康风险评估
2.3.1 美味牛肝菌矿质元素风险评估
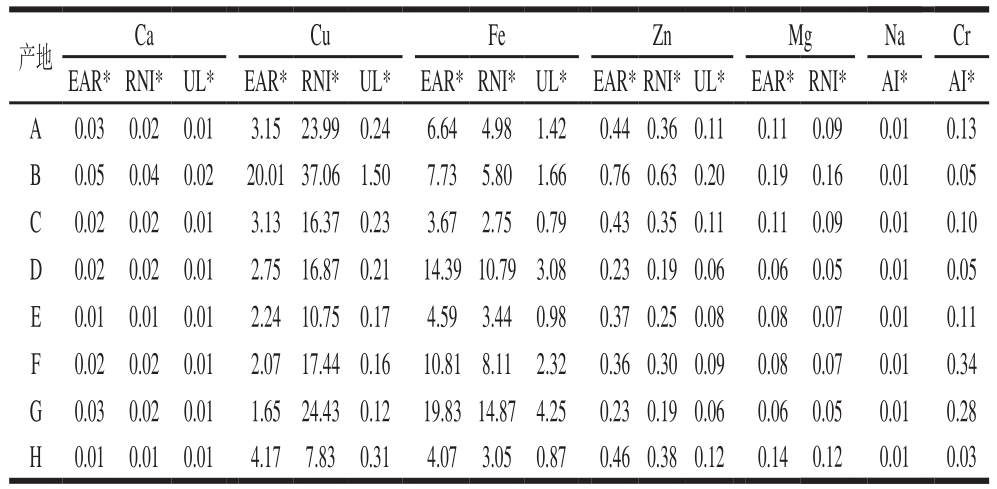
新鲜牛肝菌含水率为90%,干质量占10%[28]。中国居民膳食指南推荐蔬菜日摄入量为300~500 g。假设成年男子每天食用500 g美味牛肝菌,则摄入的矿质元素含量为500 g×10%×牛肝菌中平均矿质元素含量;根据WS/T 578《中国居民膳食营养素参考摄入量》(2018版),计算食用美味牛肝菌摄入的矿质元素与中国居民的矿质元素推荐摄入量(recommended nutrient intake,RNI)、适宜摄入量(adequate intake,AI)、可耐受最高摄入量(tolerable upper intake levels,UL)和平均需要量(estimated average requirement,EAR)的比值RNI*、AI*、UL*、EAR*,比值小于1时表明食用安全,比值大于1时表明存在健康风险。由表10可知,食用500 g新鲜牛肝菌,摄入的Ca、Zn、Mg、Na、Cr量均低于RNI、AI、UL、EAR,没有健康风险。摄入Cu的量虽然都超过EAR和RNI,但除楚雄的超过UL外,其他产地均未超过UL,在安全范围以内。摄入Fe的量均超过EAR和RNI,除玉溪、大理、曲靖未超过UL外,其他产地超过UL,存在安全风险。美味牛肝菌矿质元素含量丰富,适量食用可以补充人体所需矿物质。
表10 矿质元素风险评估
Table 10 Risk assessment of dietary exposure to mineral elements in B. edulis from different geographical origins

images/BZ_292_1299_1770_2279_1864.pngA 0.03 0.02 0.01 3.15 23.99 0.24 6.64 4.98 1.42 0.44 0.36 0.11 0.11 0.09 0.01 0.13 B 0.05 0.04 0.02 20.01 37.06 1.50 7.73 5.80 1.66 0.76 0.63 0.20 0.19 0.16 0.01 0.05 C 0.02 0.02 0.01 3.13 16.37 0.23 3.67 2.75 0.79 0.43 0.35 0.11 0.11 0.09 0.01 0.10 D 0.02 0.02 0.01 2.7516.87 0.21 14.39 10.79 3.08 0.23 0.19 0.06 0.06 0.05 0.01 0.05 E 0.01 0.01 0.01 2.2410.750.17 4.59 3.44 0.98 0.37 0.25 0.08 0.08 0.07 0.01 0.11 F 0.02 0.02 0.01 2.0717.44 0.16 10.81 8.11 2.32 0.36 0.30 0.09 0.08 0.07 0.01 0.34 G 0.03 0.02 0.01 1.6524.43 0.12 19.83 14.874.25 0.23 0.19 0.06 0.06 0.05 0.01 0.28 H 0.01 0.01 0.01 4.17 7.83 0.31 4.07 3.05 0.87 0.46 0.38 0.12 0.14 0.12 0.01 0.03
2.3.2 美味牛肝菌有毒元素Cd风险评估
重金属可通过食物链进入人体,危害人体健康[29]。根据FAO/WHO重金属限量标准,Cd每天可耐受摄入量0.001 mg/kg,假设成年人体质量60 kg。则成年人每天允许摄入的Cd含量为0.06 mg。由表11可知,成年人每天食用70 g新鲜牛肝菌摄入Cd含量为70 g×10%×产地Cd含量。其中昆明、玉溪、大理、曲靖均超过标准限量。不同产地美味牛肝菌对Cd的富集能力有所差异,对消费者健康有一定的潜在风险。
表11 成年人每天Cd摄入量均量
Table 11 Daily Cd average intake for adults via consumption of B. edulis from different geographical origins
images/BZ_292_1299_3024_2277_3119.png
3 结 论
本实验采用电感耦合等离子体发射光谱法,测定8 个产地171 个美味牛肝菌子实体中14 种元素含量,分析其特征和富集情况,评估食用价值和暴露风险。结果表明,美味牛肝菌中富含人体所需的常量元素和微量元素,适量食用可以补充人体所需,但要注意Cd暴露风险。美味牛肝菌元素之间主要以协同作用为主,部分元素之间存在拮抗作用。PCA表明不同产地美味牛肝菌中矿质元素含量具有差异,有可能与不同产地气候条件、土壤类型差异有关。
[1] 赵永昌, 方琳, 张荀, 等. 云南美味牛肝菌ITS区域结构特点[J]. 云南植物研究, 2006, 28(6): 575-580.
[2] FALANDYSZ J, FRANKOWSKA A, MAZUR A. Mercury and its bioconcentration factors in King Bolete (Boletus edulis) Bull. Fr.[J].Journal of Environmental Science and Health, Part A, 2007, 42(14):2089-2095. DOI:10.1080/10934520701627058.
[3] RATHORE H, PRASAD S, SHARMA S. Mushroom nutraceuticals for improved nutrition and better human health: a review[J]. Pharma Nutrition, 2017, 5(2): 35-46. DOI:10.1016/j.phanu.2017.02.001.
[4] FRAGA C G. Relevance, essentiality and toxicity of trace elements in human health[J]. Molecular Aspects of Medicine, 2005, 26(4/5): 235-244. DOI:10.1016/j.mam.2005.07.013.
[5] FALAH S, AL-FARTUSIE S N M. Essential trace elements and their vital roles in human body[J]. Indian Journal of Advances in Chemical Science, 2017, 5(3): 127-136. DOI:10.22607/IJACS.2017.503003.
[6] PLUM L M, RINK L, HAASE H. The essential toxin: impact of zinc on human health[J]. International Journal of Environmental Research and Public Health, 2010, 7(4): 1342-1365. DOI:10.3390/ijerph7041342.
[7] GOZZELINO R, AROSIO P. Iron homeostasis in health and disease[J]. International Journal of Molecular Sciences, 2016, 17(1):130. DOI:10.3390/ijms17010130.
[8] LUO J M, MENG J, YE Y J, et al. Population health risk via dietary exposure to trace elements (Cu, Zn, Pb, Cd, Hg, and As) in Qiqihar,Northeastern China[J]. Environmental Geochemistry and Health, 2018,40(1): 217-227. DOI:10.1007/s10653-016-9895-0.
[9] KALAČ P. Trace element contents in European species of wild growing edible mushrooms: a review for the period 2000-2009[J]. Food Chemistry, 2010, 122(1): 2-15. DOI:10.1016/j.foodchem.2010.02.045.
[10] KALAČ P. Chemical composition and nutritional value of European species of wild growing mushrooms: a review[J]. Food Chemistry,2009, 113(1): 9-16. DOI:10.1016/j.foodchem.2008.07.077.
[11] KOJTA A K, FALANDYSZ J. Metallic elements (Ca, Hg, Fe, K,Mg, Mn, Na, Zn) in the fruiting bodies of Boletus badius[J]. Food Chemistry, 2016, 200: 206-214. DOI:10.1016/j.foodchem.2016.01.006.
[12] LIPKA K, FALANDYSZ J. Accumulation of metallic elements by Amanita muscaria from rural lowland and industrial upland regions[J].Journal of Environmental Science and Health, Part B, 2017, 52(3):184-190. DOI:10.1080/03601234.2017.1261547.
[13] WANG X M, LIU H G, ZHANG J, et al. Evaluation of heavy metal concentrations of edible wild-grown mushrooms from China[J].Journal of Environmental Science and Health, 2017, 52(3): 178-183.DOI:10.1080/03601234.2017.1261545.
[14] GENÇCELEP H, UZUN Y, TUNÇTÜRK Y, et al. Determination of mineral contents of wild-grown edible mushrooms[J]. Food Chemistry,2009, 113(4): 1033-1036. DOI:10.1016/j.foodchem.2008.08.058.
[15] KALAČ P, SVOBODA L. A review of trace element concentrations in edible mushrooms[J]. Food Chemistry, 2000, 69(3): 273-281.DOI:10.1016/S0308-8146(99)00264-2.
[16] 李杰庆, 杨天伟, 王元忠, 等. 不同产地皱盖疣柄牛肝菌中矿质元素含量测定及特征分析[J]. 食品科学, 2014, 35(24): 119-122.DOI:10.7506/spkx1002-6630-201424023.
[17] 罗卉. 11 种中草药中微量元素的主成分分析[J]. 四川中医, 2012,30(8): 59-61.
[18] 王春枝. SPSS软件中主成分分析的计算技术解析[J]. 现代计算机(专业版), 2011(16): 6-8.
[19] BRZEZICHA-CIROCKA J, GREMBECKA M, GROCHOWSKA I,et al. Elemental composition of selected species of mushrooms based on a chemometric evaluation[J]. Ecotoxicology and Environmental Safety, 2019, 173: 353-365. DOI:10.1016/j.ecoenv.2019.02.036.
[20] FALANDYSZ J, KUNITO T, KUBOTA R, et al. Multivariate characterization of elements accumulated in King Bolete Boletus edulis mushroom at lowland and high mountain regions[J]. Journal of Environmental Science and Health, Part A, 2008, 43(14): 1692-1699.DOI:10.1080/10934520802330206.
[21] IVAN Š, ŽURGA P, DALIBOR B, et al. Trace element contents in the edible mushroom Boletus edulis Bull. ex Fries[J]. Agriculturae Conspectus scientificus, 2015, 80(4): 223-227.
[22] FRANKOWSKA A, ZIÓŁKOWSKA J, BIELAWSKI L, et al. Profile and bioconcentration of minerals by King Bolete (Boletus edulis) from the Płocka Dale in Poland[J]. Food Additives and Contaminants: Part B,2010, 3(1): 1-6. DOI:10.1080/19440040903505232.
[23] FALANDYSZ J, DREWNOWSKA M. Macro and trace elements in common chanterelle (Cantharellus cibarius) mushroom from the European background areas in Poland: composition, accumulation,dietary exposure and data review for species[J]. Journal of Environmental Science and Health, Part B, 2015, 50(5): 374-387.DOI:10.1080/03601234.2015.1000190.
[24] SAKELLARI A, KARAVOLTSOS S, TAGKOULI D, et al. Trace elements in Pleurotus Ostreatus, P. Eryngii, and P. Nebrodensis mushrooms cultivated on various agricultural by-products[J].Analytical Letters, 2019, 52(17): 1-18. DOI:10.1080/00032719.2019.1 594865.
[25] LI T, WANG Y Z, ZHANG J, et al. Trace element content of Boletus tomentipes mushroom collected from Yunnan, China[J].Food Chemistry, 2011, 127(4): 1828-1830. DOI:10.1016/j.foodchem.2011.02.012.
[26] 赵迎春, 鲍长俊, 孙丽平. 云南省不同产地灰褐牛肝菌矿质元素含量测定及相关性分析[J]. 云南民族大学学报(自然科学版), 2017,26(5): 349-354. DOI:10.3969/j.issn.1672-8513.2017.05.003.
[27] 苏久艳, 张霁, 李杰庆, 等. 野生牛肝菌元素含量特征分析及其种类鉴别[J]. 现代食品科技, 2019, 35(2): 223-231. DOI:10.13982/j.mfst.1673-9078.2019.2.031.
[28] 杨天伟, 张霁, 刘鸿高, 等. 云南野生牛肝菌中砷元素含量测定及食用安全评价[J]. 生态毒理学报, 2016, 11(2): 755-761. DOI:10.7524/AJE.1673-5897.20151116002.
[29] 刘少莉, 杨贞耐. 乳酸菌吸附重金属研究进展[J]. 乳业科学与技术,2019, 42(2): 23-27. DOI:10.15922/j.cnki. jdst.2019.02.005.